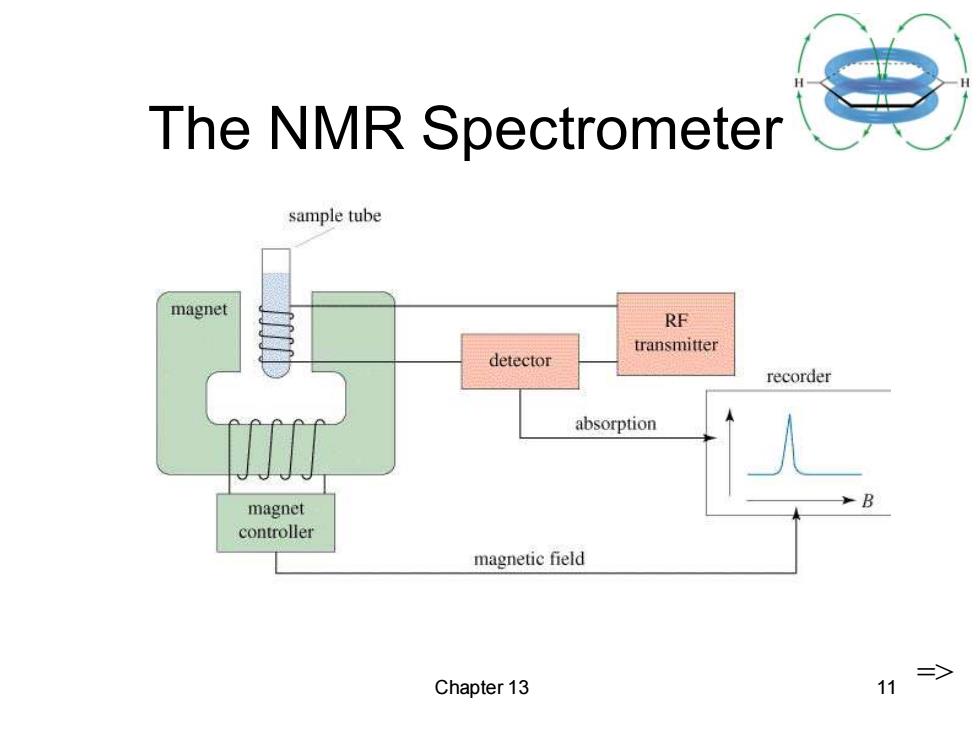
The NMR Spectrometer sample tube magnet RF transmitter detector recorder absorption B magnet controller magnetic field => Chapter 13 11
Chapter 13 11 The NMR Spectrometer =>
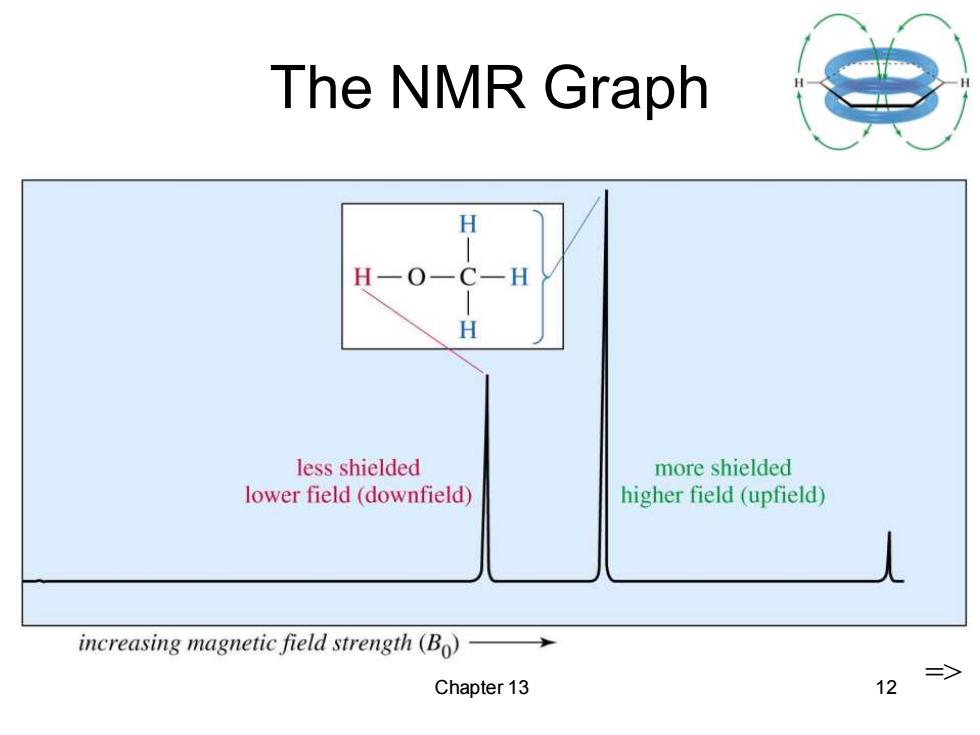
The NMR Graph H H一O-C-H H less shielded more shielded lower field(downfield) higher field(upfield) increasing magnetic field strength (Bo) => Chapter 13 12
Chapter 13 12 The NMR Graph =>
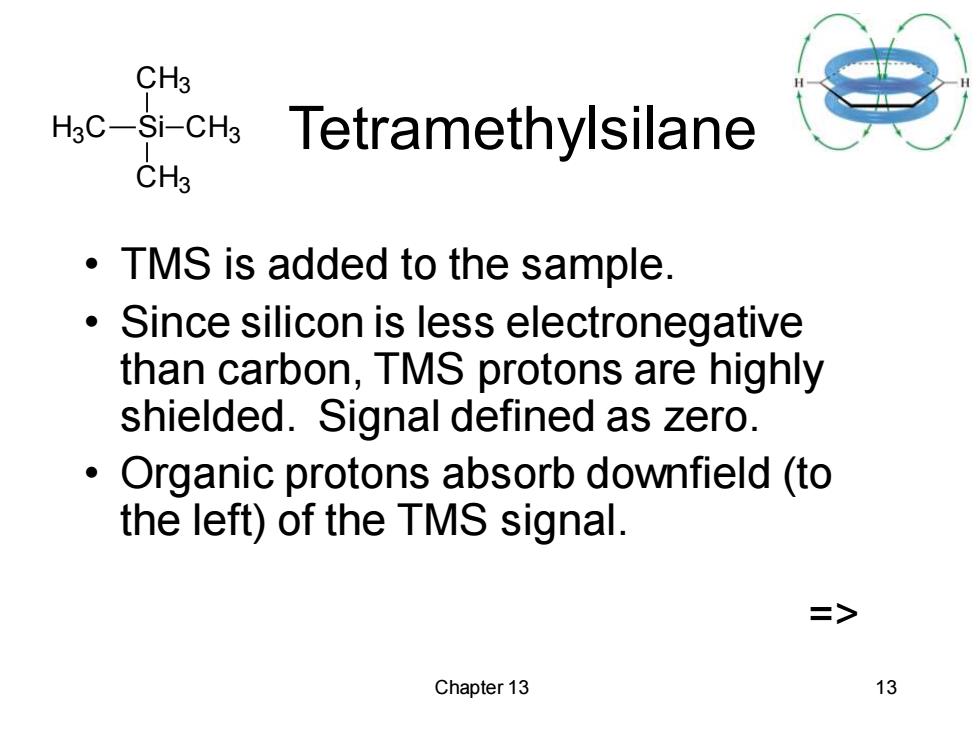
CH3 Hsc-si-CHs Tetramethylsilane CH3 TMS is added to the sample. Since silicon is less electronegative than carbon,TMS protons are highly shielded.Signal defined as zero. Organic protons absorb downfield (to the left)of the TMS signal. => Chapter 13 13
Chapter 13 13 Tetramethylsilane • TMS is added to the sample. • Since silicon is less electronegative than carbon, TMS protons are highly shielded. Signal defined as zero. • Organic protons absorb downfield (to the left) of the TMS signal. => Si CH3 CH3 CH3 H3C
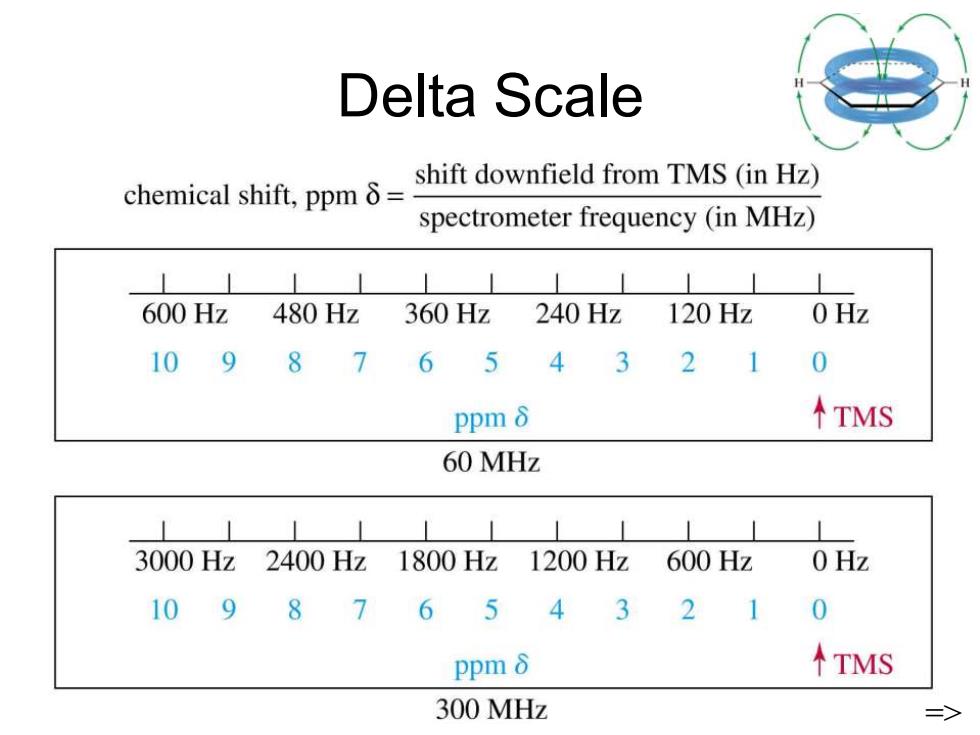
Chemical Shift Measured in parts per million. Ratio of shift downfield from TMS(Hz) to total spectrometer frequency (Hz). Same value for 60,100,or 300 MHz machine. Called the delta scale. => Chapter 13 14
Chapter 13 14 Chemical Shift • Measured in parts per million. • Ratio of shift downfield from TMS (Hz) to total spectrometer frequency (Hz). • Same value for 60, 100, or 300 MHz machine. • Called the delta scale. =>
Delta Scale chemical shift,.ppmδ= shift downfield from TMS (in Hz) spectrometer frequency (in MHz) 600Hz 480Hz360Hz 240Hz 120Hz 1098 7654321 0 ppm 8 ↑TMS 60 MHz 3000Hz 2400Hz1800Hz 1200Hz 600Hz 0Hz 10 9 8 7 65 4 3 2 1 0 Ppm 8 ↑TMS 300 MHz 二>
Chapter 13 15 Delta Scale =>