DEFINITION OF FREEZING AND FROZEN-FOOD STORAGE ◼ Food freezing is the preservation process that depends on the reduction of product temperature to levels well below the temperature at which ice crystals begin to form within the food. By reducing the temperature of the product to -10 to -20℃, the normal reactions that cause deterioration of foods are reduced to negligible or minimal rates
DEFINITION OF FREEZING AND FROZEN-FOOD STORAGE ◼ Food freezing is the preservation process that depends on the reduction of product temperature to levels well below the temperature at which ice crystals begin to form within the food. By reducing the temperature of the product to -10 to -20℃, the normal reactions that cause deterioration of foods are reduced to negligible or minimal rates

6.1 table Initial Freezing Temperatures of Foods Initial Water Freezing Content Temperature Product (by weight) (C) Apple juice 87.2 -1.44 Apple juice concentrate 49.8 -11.33 Apple sauce 82.8 -1.67 Asparagus 92.6 -0.67 Bilberries 85.1 -1.11 Bilberry juice 89.5 -1.11 Carrots 87.5 -1.11 Cherry juice 86.7 -1.44 Grape juice 84.7 -1.78 Onions 85.5 -1.44 Orange juice 89.0 -1.17 Peaches 85.1 -1.56 Pears 83.8 -1.61 Plums 80.3 -2.28 Raspberries 82.7 -1.22 Raspberry juice 88.5 -1.22 Spinach 90.2 -0.56 Strawberries 89.3 -0.89 Strawberry juice 91.7 -0.89 Sweet cherries 77.0 -2.61 Tall peas 75.8 -1.83 Tomato pulp 92.9 -0.72 From Heldman and Singh(1981)
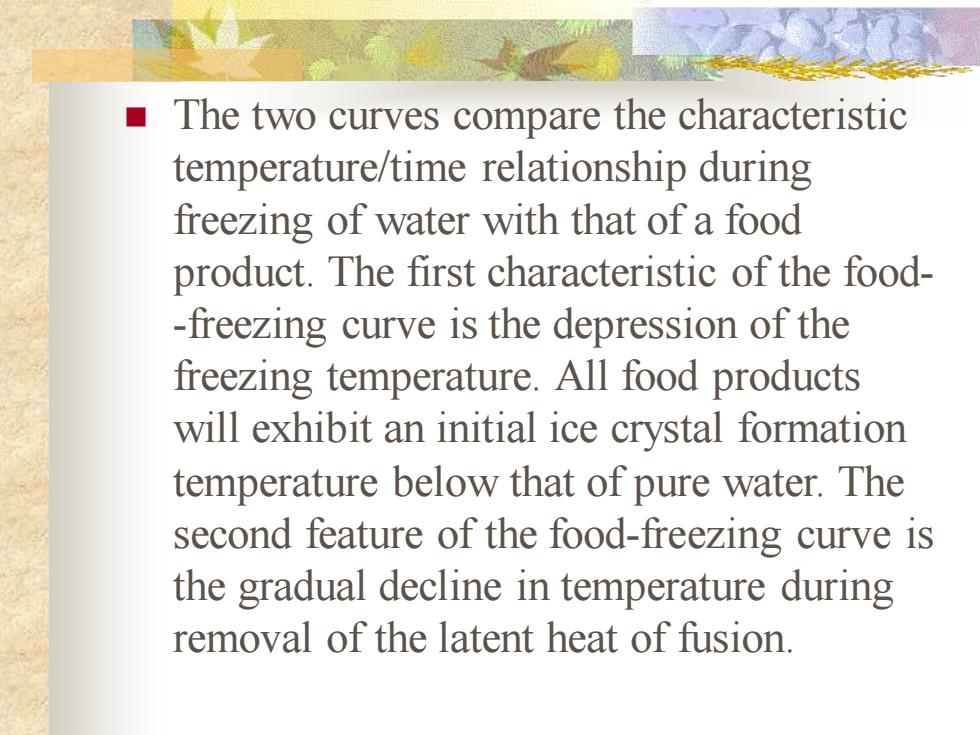
◼ The two curves compare the characteristic temperature/time relationship during freezing of water with that of a food product. The first characteristic of the food- -freezing curve is the depression of the freezing temperature. All food products will exhibit an initial ice crystal formation temperature below that of pure water. The second feature of the food-freezing curve is the gradual decline in temperature during removal of the latent heat of fusion
◼ The two curves compare the characteristic temperature/time relationship during freezing of water with that of a food product. The first characteristic of the food- -freezing curve is the depression of the freezing temperature. All food products will exhibit an initial ice crystal formation temperature below that of pure water. The second feature of the food-freezing curve is the gradual decline in temperature during removal of the latent heat of fusion
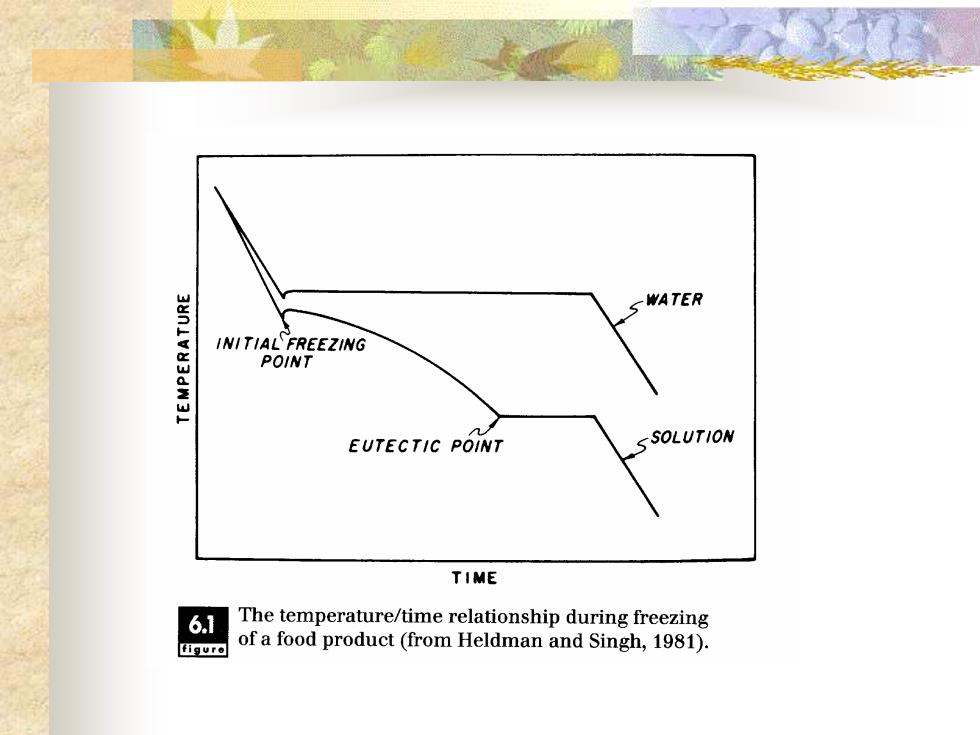
SWATER INITIAL FREEZING POINT EUTECTIC POINT SSOLUTION TIME 6.1 The temperature/time relationship during freezing figure of a food product(from Heldman and Singh,1981)
Freezing-temperature Depression ◼ The formation of ice crystals within the water phase results in a concentration of solutes within the water phase. The ice crystals are pure water in the solid state. The result of the increased concentration of the solute in the liquid phase causes depression of the freezing temp. , a lower temp. at which ice crystals will form. Since these changes occur on a continuous basis, the gradual temp. decline with time is a direct result of freezing-temperature depression
Freezing-temperature Depression ◼ The formation of ice crystals within the water phase results in a concentration of solutes within the water phase. The ice crystals are pure water in the solid state. The result of the increased concentration of the solute in the liquid phase causes depression of the freezing temp. , a lower temp. at which ice crystals will form. Since these changes occur on a continuous basis, the gradual temp. decline with time is a direct result of freezing-temperature depression