11-3 Chemical Shifts Upfield AusueluI (shielded) Downfield Calibration peak (deshielded) (TMS) 10 6 4 1 0 ppm Low-field Direction of field sweep- High-field- The NMR Chart The downfield,deshielded side is on the left,and requires a lower field strength for resonance The upfield,shielded side is on the right,and requires a higher field strength for resonance The tetramethylsilane(TMS)absorption is used as a reference point
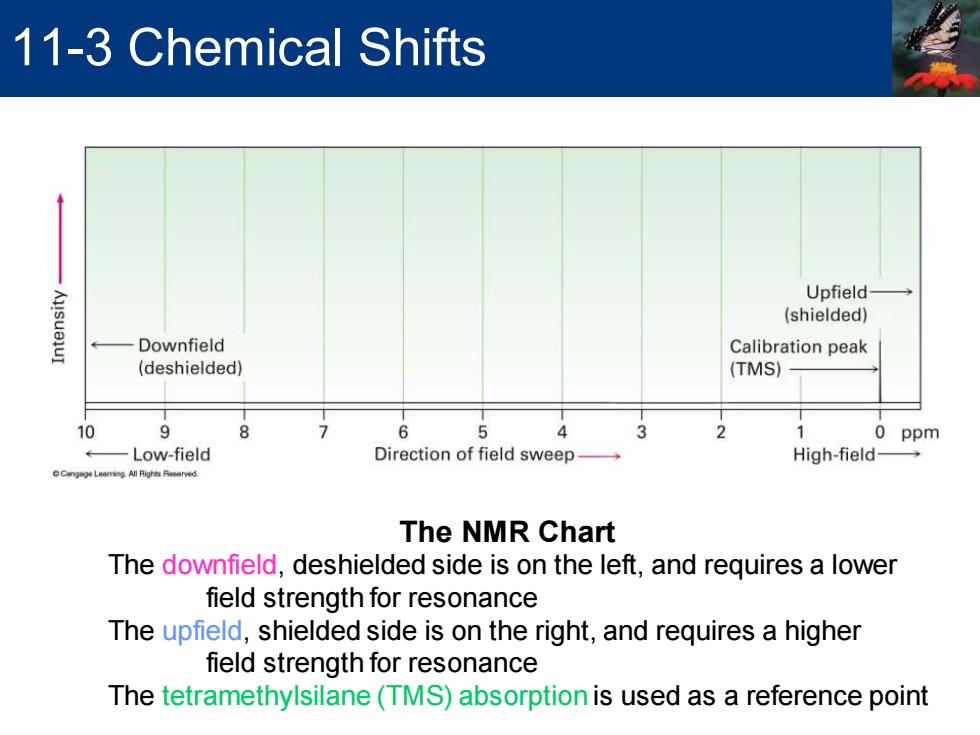
The NMR Chart The downfield, deshielded side is on the left, and requires a lower field strength for resonance The upfield, shielded side is on the right, and requires a higher field strength for resonance The tetramethylsilane (TMS) absorption is used as a reference point 11-3 Chemical Shifts

Chemical Shifts Chemical shift Position on NMR chart at which a nucleus absorbs The chemical shift of TMS is set as zero point -Other absorptions normally occur downfield -NMR charts calibrated using delta (8)scale 1 8=1 part per million of operating frequency =Chemical shift (number of Hz downfield from TMS) Spectrometer frequency in MHz Chemical shift of an NMR absorption in units is constant,regardless of the operating frequency of the spectrometer
Chemical shift ▪ Position on NMR chart at which a nucleus absorbs ▪ The chemical shift of TMS is set as zero point ▪ Other absorptions normally occur downfield ▪ NMR charts calibrated using delta (d) scale ▪ 1 d = 1 part per million of operating frequency ▪ Chemical shift of an NMR absorption in d units is constant, regardless of the operating frequency of the spectrometer Chemical shift (number of Hz downfield from TMS) δ = Spectrometer frequency in MHz Chemical Shifts

Chemical Shifts Narrow NMR absorption range ·0to10δfor1HNMR ■0to220δfor13CNMR Higher magnetic field instruments have greater dispersion of NMR signals Two signals that are 20 Hz apart(0.1 ppm)at 200 MHz are 50 Hz(0.1 ppm)apart at 500 MHz Accidental overlap of nonequivalent signals decreases with increasing field strength
Narrow NMR absorption range ▪ 0 to 10 d for 1H NMR ▪ 0 to 220 d for 13C NMR Higher magnetic field instruments have greater dispersion of NMR signals ▪ Two signals that are 20 Hz apart (0.1 ppm) at 200 MHz are 50 Hz (0.1 ppm) apart at 500 MHz ▪ Accidental overlap of nonequivalent signals decreases with increasing field strength Chemical Shifts
11-4 13C NMR Spectroscopy:Signal Averaging and FT-NMR Carbon-13 is only naturally occurring carbon isotope with a nuclear spin Natural abundance of 13C is 1.1% Low abundance of 13C is overcome by signal averaging and Fourier-transform NMR(FT-NMR)
Carbon-13 is only naturally occurring carbon isotope with a nuclear spin ▪ Natural abundance of 13C is 1.1% ▪ Low abundance of 13C is overcome by signal averaging and Fourier-transform NMR (FT-NMR) 11-4 13C NMR Spectroscopy: Signal Averaging and FT-NMR

13C NMR Spectroscopy:Signal Averaging and FT-NMR Signal averaging -Numerous individual runs are added together and averaged such that random background noise cancels to zero and NMR signals are enhanced,substantially increasing sensitivity ▣FT-NMR Sample is irradiated with entire range of useful frequencies -All 1H or 13C nuclei in the sample resonate at once giving complex,composite signal that is mathematically manipulated by Fourier transforms to segregate individual signals
▪ Signal averaging ▪ Numerous individual runs are added together and averaged such that random background noise cancels to zero and NMR signals are enhanced, substantially increasing sensitivity ▪ FT-NMR ▪ Sample is irradiated with entire range of useful frequencies ▪ All 1H or 13C nuclei in the sample resonate at once giving complex, composite signal that is mathematically manipulated by Fourier transforms to segregate individual signals 13C NMR Spectroscopy: Signal Averaging and FT-NMR