
四:单窗口多曲线分图绘图 Subplot-—子图分割命令 subplot的调用格式: subplot(m,n,p)一m为行,n为列,p=mxn 按从左至右,从上至下排列
四:单窗口多曲线分图绘图 ⚫Subplot—— 子图分割命令 subplot的调用格式: subplot(m,n,p) ——m为行,n为列,p=mxn 按从左至右,从上至下排列
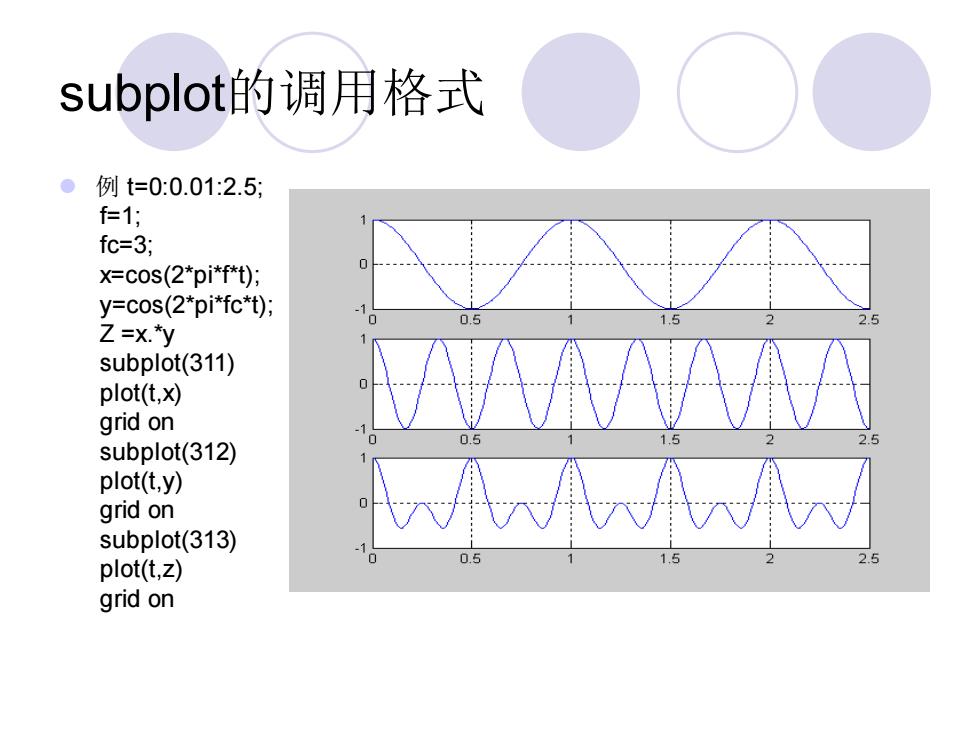
subplot的调用格式 ● 例t=0:0.01:2.5; f仁1; fc=3; x=cos(2*pi*f*t); y=cos(2*pi*fc*t); 0.5 1.5 2.5 Z=x.*y 2 subplot(311) plot(t,x) grid on 1.5 2 subplot(312) plot(t,y) grid on subplot(313) plot(t,z) 0.5 1,5 2.5 grid on
subplot的调用格式 ⚫ 例 t=0:0.01:2.5; f=1; fc=3; x=cos(2*pi*f*t); y=cos(2*pi*fc*t); Z =x.*y subplot(311) plot(t,x) grid on subplot(312) plot(t,y) grid on subplot(313) plot(t,z) grid on

subplotI的调用格式 ● 例t=0:0.01:1; f仁1; fc=3*f: 0.8 0.8 0.8 x=cos(2*pi*f*t); 0.6 0.6 y=cos(2*pi*fc*t); 0.6 0.4 0.4 Z =x.*y 0.4 0.2 0.2 subplot(131) plot(t,x) grid on -0.2 0.2 subplot(132) 0.4 0.2 plot(t,y) 0.6 0.6 grid on 0.4 -0.8 -0.8 subplot(133) 0.6 plot(t,z) 0.5 0.5 0.5 grid on
subplot的调用格式 ⚫ 例 t=0:0.01:1; f=1; fc=3*f; x=cos(2*pi*f*t); y=cos(2*pi*fc*t); Z =x.*y subplot(131) plot(t,x) grid on subplot(132) plot(t,y) grid on subplot(133) plot(t,z) grid on

五:figure(n)用法 ●多窗口绘图 figure(n)一创建窗口函数,n为窗口顺序号。 t=0:pi/100:2*pi; y1=sin(t);y2=sin(t+0.25)y3=sin(t+0.5); figure(1) plot(t,y1) %出现第一个窗口 0.8 0.6 0.4 02 -0.2 0.4 -0.6 0.8
五: figure(n)用法 ⚫多窗口绘图 figure(n) —— 创建窗口函数,n为窗口顺序号。 t=0:pi/100:2*pi; y1=sin(t);y2=sin(t+0.25);y3=sin(t+0.5); figure(1) plot(t,y1) %出现第一个窗口
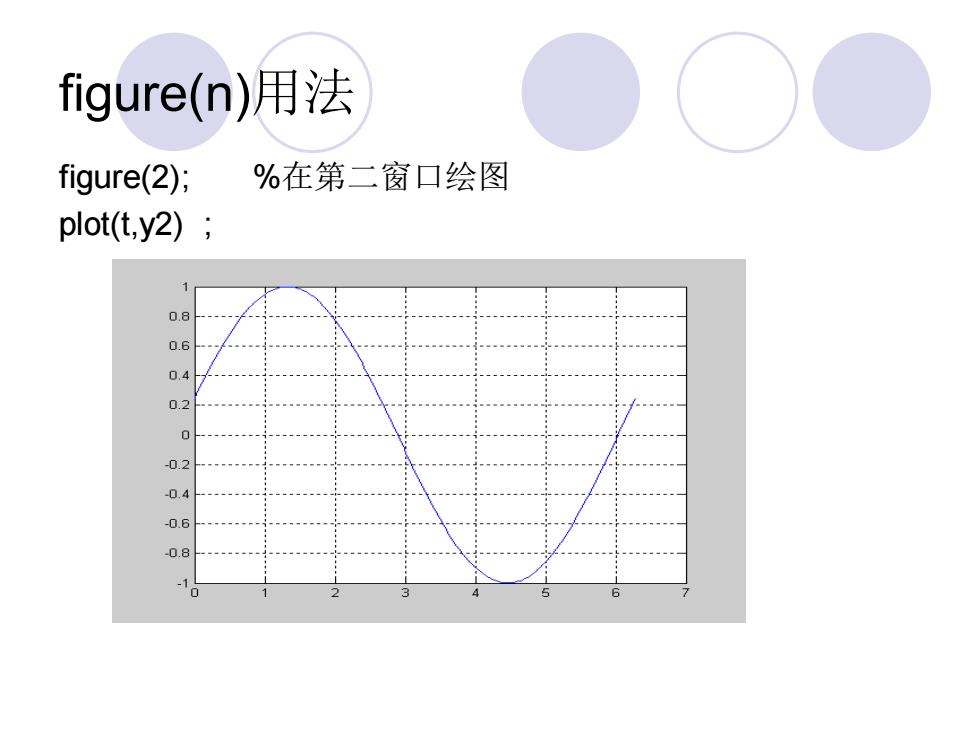
figure(n)用法 figure(2); %在第二窗口绘图 plot(t,y2); 0.8 0.6 0.4 0.2 -0.2 -0.4 -0.6 -0.8 -1 0 5 6
figure(n)用法 figure(2); %在第二窗口绘图 plot(t,y2) ;