
figure(n)用法 figure(3) %在第三窗口绘图 plot(t,y3) 1 0.8 0.6 0.4 0.2 0 -0.2 -0.4 -0.6 -0.8 1 0
figure(n)用法 figure(3) %在第三窗口绘图 plot(t,y3)

六:图形加注功能 tite一给图形加标题 xlable一给x轴加标注 ylable一给y轴加标注 text一在图形指定位置加标注 grid on(off一打开、关闭坐标网格线 legend—添加图例 axis一控制坐标轴的刻度
六:图形加注功能 ⚫ title —— 给图形加标题 xlable —— 给x轴加标注 ylable —— 给y轴加标注 text —— 在图形指定位置加标注 grid on(off) —— 打开、关闭坐标网格线 legend —— 添加图例 axis —— 控制坐标轴的刻度
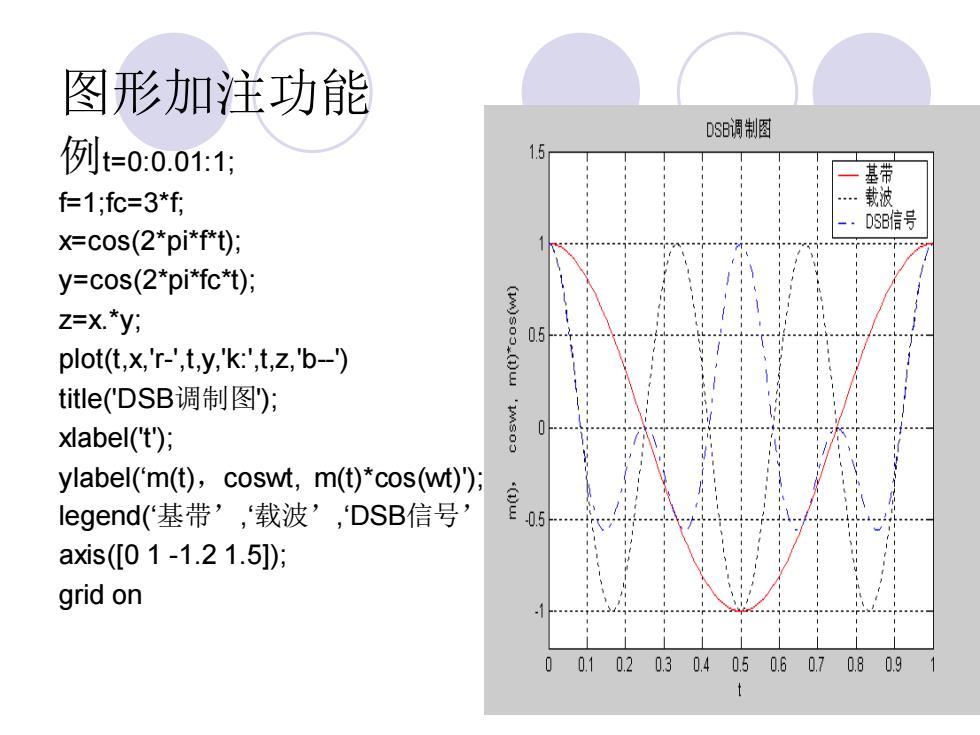
图形加注功能 DSB调制图 例t=0:0.011; 基带 f=1;fc=3*f; 载波 DS8信号 x=cos(2*pi*f*t); y=cos(2*pi*fc*t); z=X.*y; 0.5 plot(t,x,'r-',t,y,'k:',t,z,'b-) title(DSB调制图); xlabel('t); ylabel('m(t),coswt,m(t)*cos(wt)); legend('基带',‘载波',DSB信号' axis(01-1.21.5]); grid on 00.10.20.30.40.50.607 080.9 t
图形加注功能 例t=0:0.01:1; f=1;fc=3*f; x=cos(2*pi*f*t); y=cos(2*pi*fc*t); z=x.*y; plot(t,x,'r-',t,y,'k:',t,z,'b-') title('DSB调制图'); xlabel('t'); ylabel(‘m(t),coswt, m(t)*cos(wt)'); legend(‘基带’,‘载波’,‘DSB信号’,1); axis([0 1 -1.2 1.5]); grid on
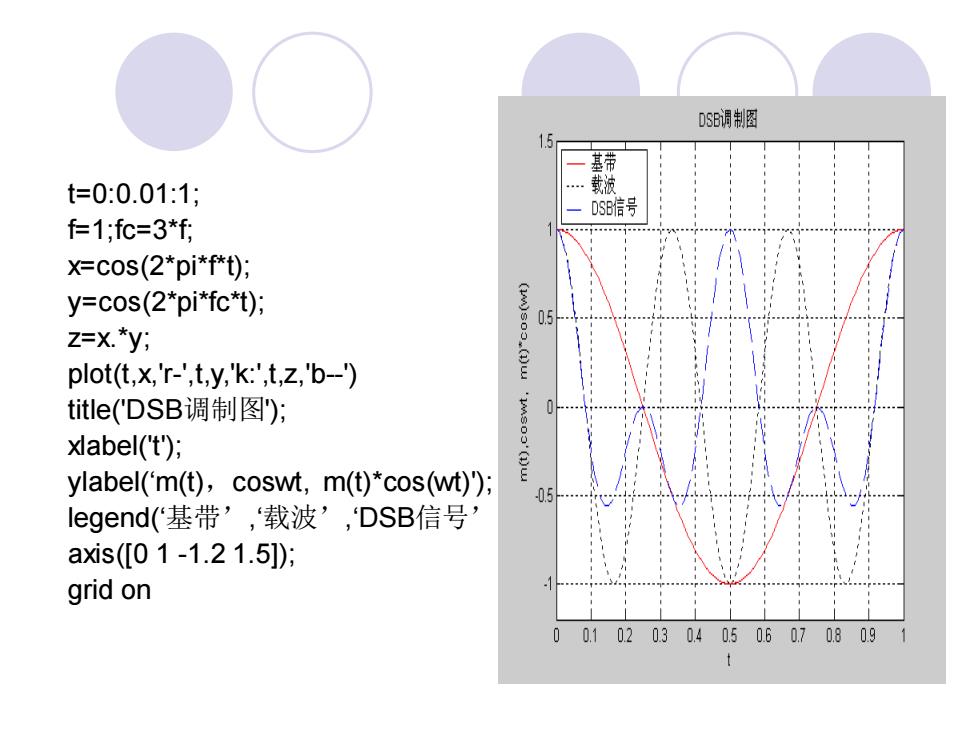
DSE调制图 15 基带 t=0:0.01:1; 载液 DS8信号 f=1:fc=3*f: x=cos(2*pi*f*t); y=cos(2*pi*fc*t); Z=X.*y; plot(t,x,'r-',t,y,'k:',t,z,'b-) title(DSB调制图); xlabel(t); ylabel('m(t),coswt,m(t)*cos(wt)'); 05 legend(基带’,载波’,DSB信号 axis([01-1.21.5]): grid on 0 0.102 0304050.60.708091
t=0:0.01:1; f=1;fc=3*f; x=cos(2*pi*f*t); y=cos(2*pi*fc*t); z=x.*y; plot(t,x,'r-',t,y,'k:',t,z,'b-') title('DSB调制图'); xlabel('t'); ylabel(‘m(t),coswt, m(t)*cos(wt)'); legend(‘基带’,‘载波’,‘DSB信号’,2); axis([0 1 -1.2 1.5]); grid on
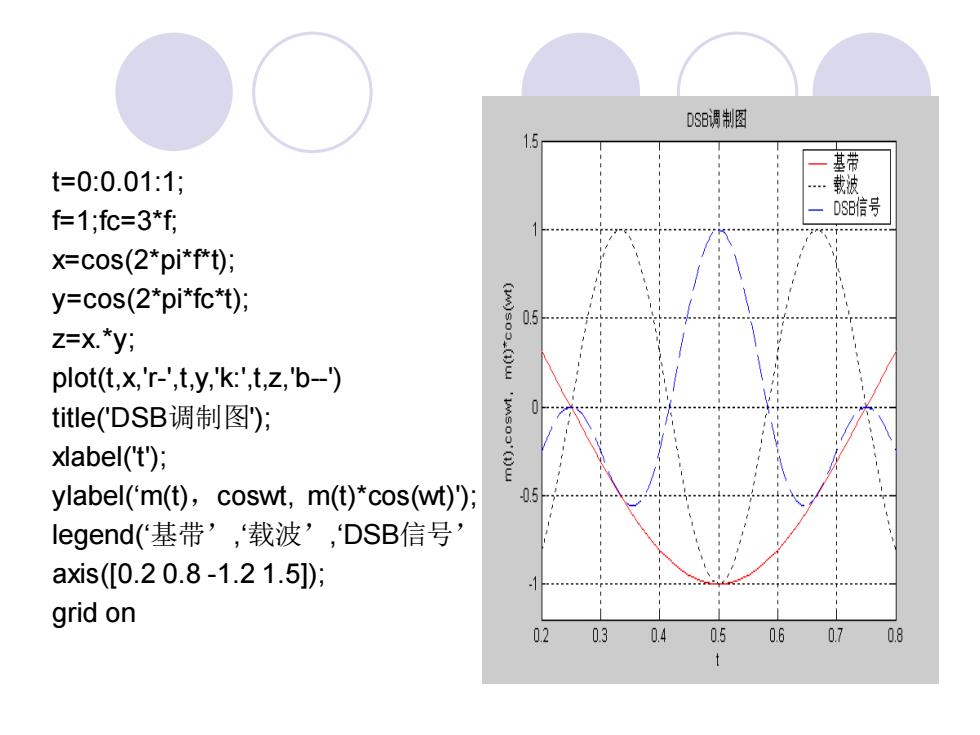
DS8调制图 1.5 基带 t=0:0.01:1; 载波 f=1;fc=3*f; DS8信号 x=cos(2*pi*f*t); y=cos(2*pi*fc*t); Z=X.*y; plot(t,x,'r-',t,y,'k:',t,z,'b-) title('DSB调制图); xlabel('t); (1 ylabel('m(t),coswt,m(t)*cos(wt)); legend(基带’,‘载波',DSB信号, axis([0.20.8-1.21.5]); grid on 02 03 040.5 0.6 07 0.8 t
t=0:0.01:1; f=1;fc=3*f; x=cos(2*pi*f*t); y=cos(2*pi*fc*t); z=x.*y; plot(t,x,'r-',t,y,'k:',t,z,'b-') title('DSB调制图'); xlabel('t'); ylabel(‘m(t),coswt, m(t)*cos(wt)'); legend(‘基带’,‘载波’,‘DSB信号’,1); axis([0.2 0.8 -1.2 1.5]); grid on