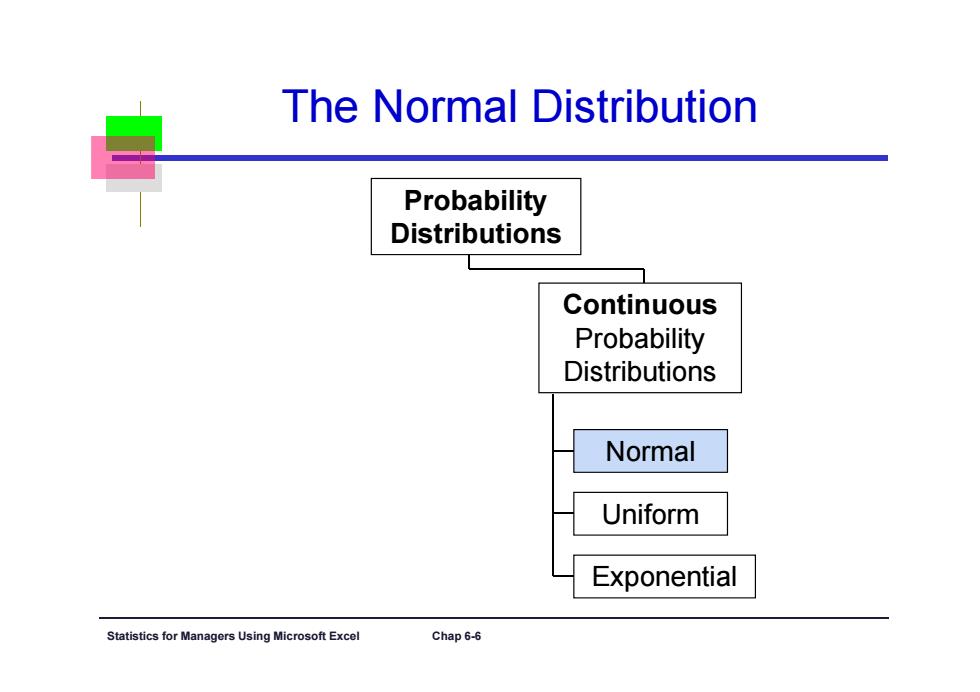
The Normal Distribution Probability Distributions Continuous Probability Distributions Normal Uniform Exponential Statistics for Managers Using Microsoft Exce Chap 6-6
Statistics for Managers Using Microsoft Excel Chap 6-6 The Normal Distribution Probability Distributions Normal Uniform Exponential Continuous Probability Distributions

The Normal Distribution Properties Bell Shaped ☒ >Symmetrical > Mean,Median and Mode are all identical Location is determined by the mean,u Spread is determined by the standard deviation,o Mean Median The random variable X has an =Mode infinite theoretical range: +0t0-o(i.e,-o<X<+o) Statistics for Managers Using Microsoft Excel Chap 6-7
Statistics for Managers Using Microsoft Excel Chap 6-7 The Normal Distribution Properties Mean = Median = Mode f(X) μ σ ‘Bell Shaped’ Symmetrical Mean, Median and Mode are all identical Location is determined by the mean, μ Spread is determined by the standard deviation, σ The random variable X has an infinite theoretical range: + to (i.e., <X< + )

Many Normal Distributions By varying the parameters u and o,we obtain different normal distributions Statistics for Ma Using Microsoft Excel Chap 6-8
Statistics for Managers Using Microsoft Excel Chap 6-8 By varying the parameters μ and σ, we obtain different normal distributions Many Normal Distributions

The Normal Distribution Shape f(X) Changingμshifts the distribution left or right. Changing o increases or decreases the spread X Statistics for Managers Using Microsoft Excel Chap 6-9
Statistics for Managers Using Microsoft Excel Chap 6-9 The Normal Distribution Shape Changing μ shifts the distribution left or right. Changing σ increases or decreases the spread. X f(X) μ σ
Probability Density Function >A density curve (or probability density function,PDF)is a graph of a continuous probability distribution.It must satisfy the following properties: The total area under the curve must equal 1 Every point on the curve must have a vertical height that is 0 or greater Statistics for Managers Using Microsoft Excel Chap 6-10
Statistics for Managers Using Microsoft Excel Chap 6-10 Probability Density Function A density curve (or probability density function, PDF) is a graph of a continuous probability distribution. It must satisfy the following properties: The total area under the curve must equal 1 Every point on the curve must have a vertical height that is 0 or greater