Statistics for Managers Using MicrosoftR Excel Chapter 2 Presenting Data in Tables and Charts Statistics for Managers Using Microsoft Excel Chap 2-1
Statistics for Managers Using Microsoft Excel Chap 2-1 Statistics for Managers Using Microsoft® Excel Chapter 2 Presenting Data in Tables and Charts
Learning Objectives In this chapter,you will learn: To develop tables and charts for categorical data To develop tables and charts for numerical data The principles of properly presenting graphs Statistics for Managers Using Microsoft Excel Chap 2-2 Tongji University,School of Economics Management
Statistics for Managers Using Microsoft Excel Chap 2-2 Tongji University, School of Economics & Management Learning Objectives In this chapter, you will learn: To develop tables and charts for categorical data To develop tables and charts for numerical data The principles of properly presenting graphs
Why need tables and charts? >As a general,appropriate tables and charts should be constructed whenever a set of data contains about 20 or more observations. >The important features or characteristics of the data from these tables and charts can be extracted Data are organized and presented in the form of tables and charts in order to enhance data analysis and interpretation Statistics for Managers Using Microsoft Excel Chap 2-3 Tongji University,School of Economics Management
Statistics for Managers Using Microsoft Excel Chap 2-3 Tongji University, School of Economics & Management Why need tables and charts? As a general, appropriate tables and charts should be constructed whenever a set of data contains about 20 or more observations. The important features or characteristics of the data from these tables and charts can be extracted Data are organized and presented in the form of tables and charts in order to enhance data analysis and interpretation
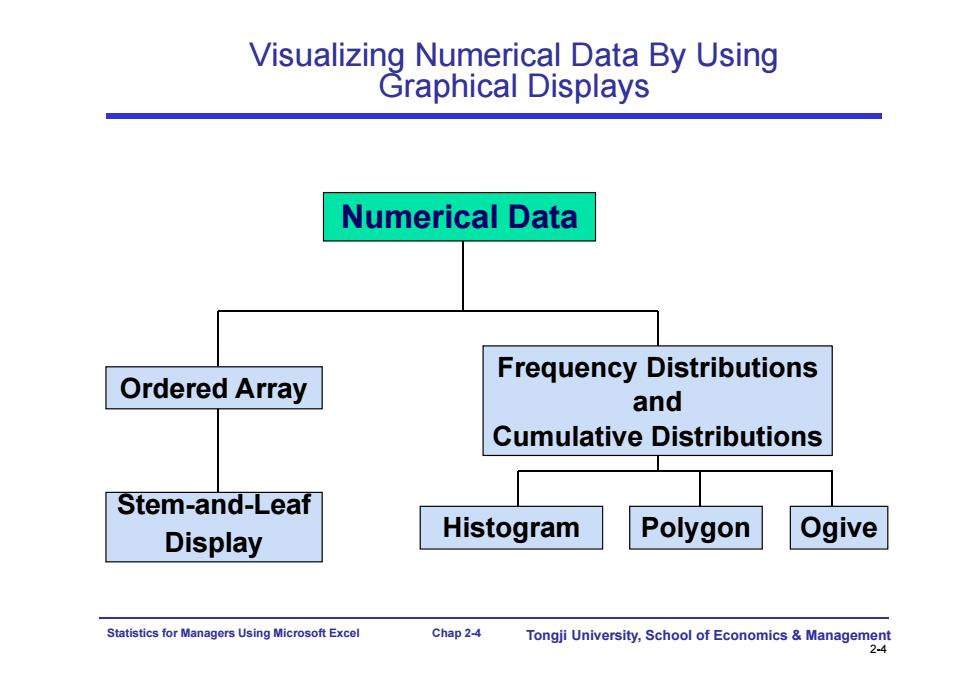
Visualizing Numerical Data By Using Graphical Displays Numerical Data Frequency Distributions Ordered Array and Cumulative Distributions Stem-and-Leaf Display Histogram Polygon Ogive Statistics for Managers Using Microsoft Excel Chap 2-4 Tongji University,School of Economics Management 2-4
Statistics for Managers Using Microsoft Excel Chap 2-4 Tongji University, School of Economics & Management 2-4 Visualizing Numerical Data By Using Graphical Displays Numerical Data Ordered Array Stem-and-Leaf Display Histogram Polygon Ogive Frequency Distributions and Cumulative Distributions

Organizing Numerical Data: Ordered Array An ordered array is a sequence of raw data,in rank order,from the smallest value to the largest value. The ordered array makes it easier to pick out extremes, typical values,and the area where the majority of the values are concentrated Age of Day Students Surveyed 16 17 17 18 18 18 College Students 19 19 20 20 21 22 22 25 27 32 38 42 Night Students 18 18 19 19 20 21 23 28 32 33 41 45 Statistics for Managers Using Microsoft Excel Chap 2-5 Tongji University,School of Economics Management
Statistics for Managers Using Microsoft Excel Chap 2-5 Tongji University, School of Economics & Management Organizing Numerical Data: Ordered Array An ordered array is a sequence of raw data, in rank order, from the smallest value to the largest value. The ordered array makes it easier to pick out extremes, typical values, and the area where the majority of the values are concentrated. Age of Surveyed College Students Day Students 16 17 17 18 18 18 19 19 20 20 21 22 22 25 27 32 38 42 Night Students 18 18 19 19 20 21 23 28 32 33 41 45