
Organizing Numerical Data: Stem-and-Leaf Display A stem-and-leaf display organizes data into groups(called stems) so that the values within each group(the leaves)branch out to the right on each row. The stem-and-leaf display is a valuable tool for organizing a set of data and understanding how the values distribute and cluster over the range of the observations in the data set. Age of College Students Day Students Night Students Stem Leaf Stem Leaf 167788899 8899 20012257 2 0138 328 3 23 42 4 15 Statistics for Managers Using Microsoft Excel Chap 2-6 Tongji University,School of Economics Management
Statistics for Managers Using Microsoft Excel Chap 2-6 Tongji University, School of Economics & Management Organizing Numerical Data: Stem-and-Leaf Display A stem-and-leaf display organizes data into groups (called stems) so that the values within each group (the leaves) branch out to the right on each row. The stem-and-leaf display is a valuable tool for organizing a set of data and understanding how the values distribute and cluster over the range of the observations in the data set. Stem Leaf 1 67788899 2 0012257 3 28 4 2 Age of College Students Day Students Night Students Stem Leaf 1 8899 2 0138 3 23 4 15
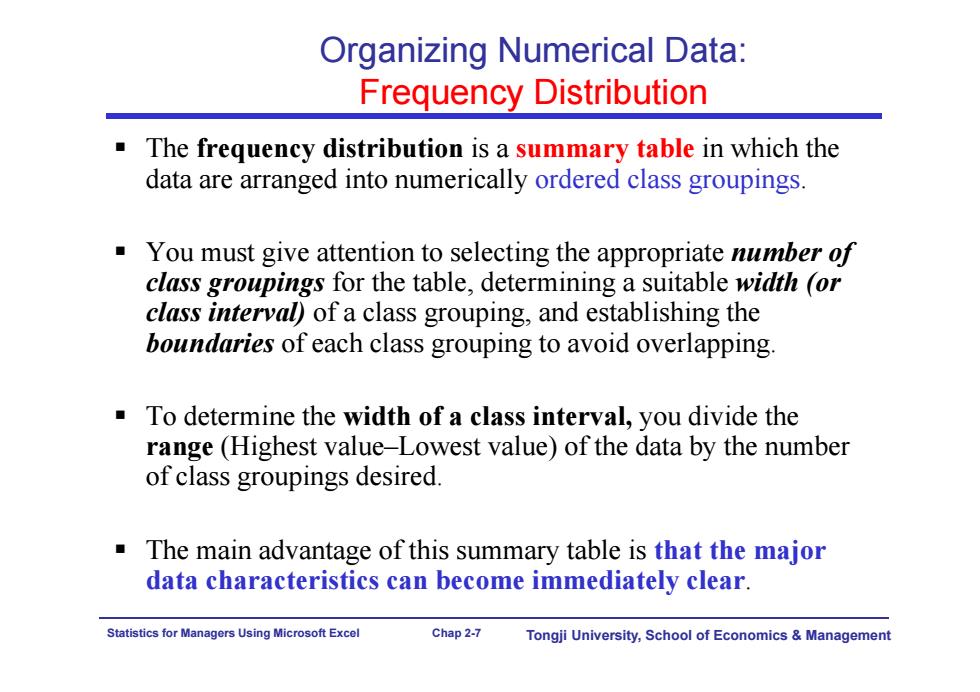
Organizing Numerical Data: Frequency Distribution The frequency distribution is a summary table in which the data are arranged into numerically ordered class groupings. You must give attention to selecting the appropriate number of class groupings for the table,determining a suitable width (or class interval)of a class grouping,and establishing the boundaries of each class grouping to avoid overlapping. To determine the width of a class interval,you divide the range (Highest value-Lowest value)of the data by the number of class groupings desired. The main advantage of this summary table is that the major data characteristics can become immediately clear. Statistics for Managers Using Microsoft Excel Chap 2-7 Tongji University,School of Economics Management
Statistics for Managers Using Microsoft Excel Chap 2-7 Tongji University, School of Economics & Management Organizing Numerical Data: Frequency Distribution The frequency distribution is a summary table in which the data are arranged into numerically ordered class groupings. You must give attention to selecting the appropriate number of class groupings for the table, determining a suitable width (or class interval) of a class grouping, and establishing the boundaries of each class grouping to avoid overlapping. To determine the width of a class interval, you divide the range (Highest value–Lowest value) of the data by the number of class groupings desired. The main advantage of this summary table is that the major data characteristics can become immediately clear
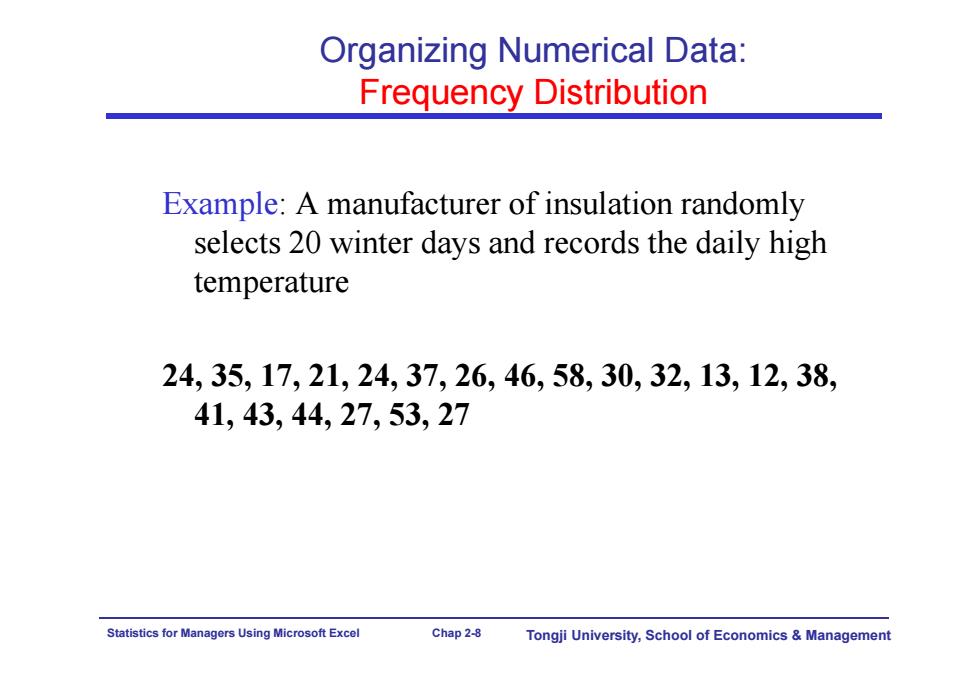
Organizing Numerical Data: Frequency Distribution Example:A manufacturer of insulation randomly selects 20 winter days and records the daily high temperature 24,35,17,21,24,37,26,46,58,30,32,13,12,38, 41,43,44,27,53,27 Statistics for Managers Using Microsoft Excel Chap 2-8 Tongji University,School of Economics Management
Statistics for Managers Using Microsoft Excel Chap 2-8 Tongji University, School of Economics & Management Organizing Numerical Data: Frequency Distribution Example: A manufacturer of insulation randomly selects 20 winter days and records the daily high temperature 24, 35, 17, 21, 24, 37, 26, 46, 58, 30, 32, 13, 12, 38, 41, 43, 44, 27, 53, 27
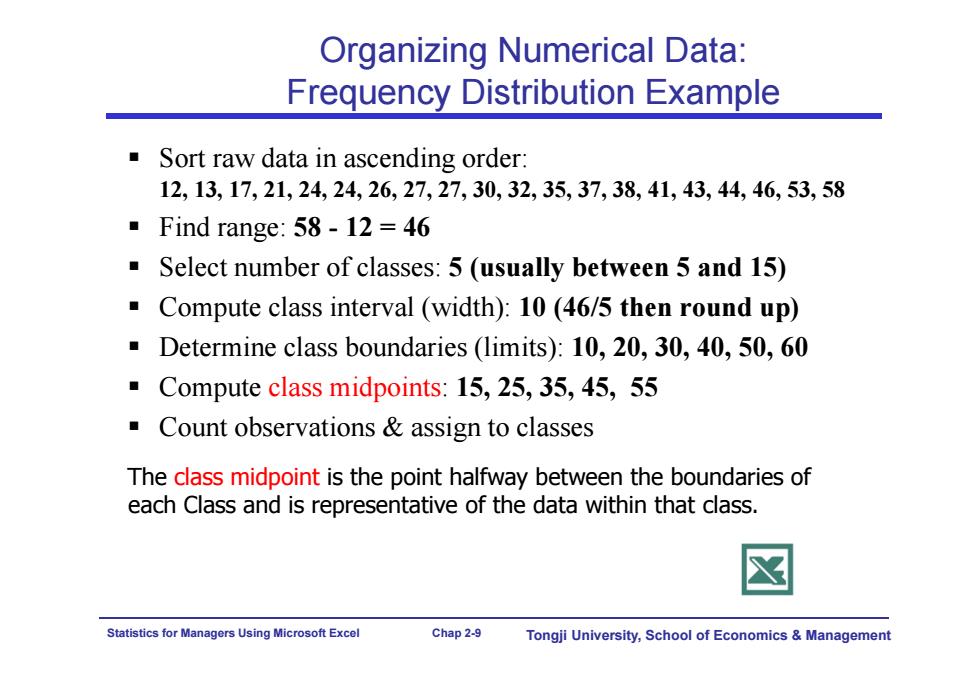
Organizing Numerical Data: Frequency Distribution Example Sort raw data in ascending order: 12,13,17,21,24,24,26,27,27,30,32,35,37,38,41,43,44,46,53,58 ■Find range:58-12=46 Select number of classes:5(usually between 5 and 15) Compute class interval (width):10(46/5 then round up) Determine class boundaries (limits):10,20,30,40,50,60 Compute class midpoints:15,25,35,45,55 Count observations assign to classes The class midpoint is the point halfway between the boundaries of each Class and is representative of the data within that class Statistics for Managers Using Microsoft Excel Chap 2-9 Tongji University,School of Economics Management
Statistics for Managers Using Microsoft Excel Chap 2-9 Tongji University, School of Economics & Management Organizing Numerical Data: Frequency Distribution Example Sort raw data in ascending order: 12, 13, 17, 21, 24, 24, 26, 27, 27, 30, 32, 35, 37, 38, 41, 43, 44, 46, 53, 58 Find range: 58 - 12 = 46 Select number of classes: 5 (usually between 5 and 15) Compute class interval (width): 10 (46/5 then round up) Determine class boundaries (limits): 10, 20, 30, 40, 50, 60 Compute class midpoints: 15, 25, 35, 45, 55 Count observations & assign to classes The class midpoint is the point halfway between the boundaries of each Class and is representative of the data within that class
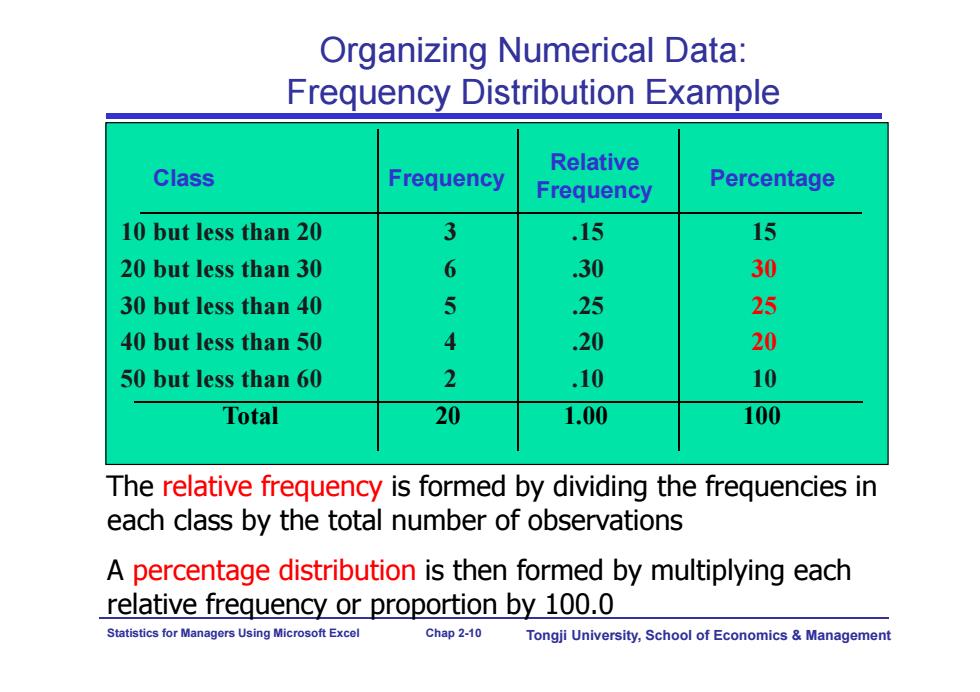
Organizing Numerical Data: Frequency Distribution Example Relative Class Frequency Frequency Percentage 10 but less than 20 3 15 15 20 but less than 30 6 .30 30 30 but less than 40 5 25 25 40 but less than 50 4 .20 20 50 but less than 60 2 .10 10 Total 20 1.00 100 The relative frequency is formed by dividing the frequencies in each class by the total number of observations A percentage distribution is then formed by multiplying each relative frequency or proportion by 100.0 Statistics for Managers Using Microsoft Excel Chap 2-10 Tongji University,School of Economics Management
Statistics for Managers Using Microsoft Excel Chap 2-10 Tongji University, School of Economics & Management Class Frequency 10 but less than 20 3 .15 15 20 but less than 30 6 .30 30 30 but less than 40 5 .25 25 40 but less than 50 4 .20 20 50 but less than 60 2 .10 10 Total 20 1.00 100 Relative Frequency Percentage Organizing Numerical Data: Frequency Distribution Example The relative frequency is formed by dividing the frequencies in each class by the total number of observations A percentage distribution is then formed by multiplying each relative frequency or proportion by 100.0