Applied Statisties(A).June.01 同济大学课程考核试卷(A卷) 2011一2012学年第2学期 Final Exam (A)for Applied Statistics.(Open Book) Tongji University,Second Semester of 2011-2012 Instructions: You have 2 hours for the exam.To receive full credit.you must hand in your exam You may use the lecture notes and the te xtbook during the exam.You can also use a calculator or a laptop.If you use EXCEL to obtain a final result,you'd better write out the processes in EXCEL about how to get the final result. Show your work for each question.The logic underly ing your analysis is m ore important than the final answer.I have tried to leave a gen erous amount of space to answer each question.Of course,do not feel that you need to fill up all the space. When in doubt,ask.I will rarely be sym pathetic if you answer a questio n incorrectly because you misinterpreted it. Good luck! Student I.D. Name
Applied Statistics (A), June, 2012 1 同济大学课程考核试卷(A 卷) 2011—2012 学年第 2 学期 Final Exam (A) for Applied Statistics. (Open Book) Tongji University, Second Semester of 2011-2012 Instructions: You have 2 hours for the exam . To receive full credit, you must hand in your exam promptly at the end of all the allotted time. Be sure to answer all question s. There are total 8 pages including this instruction page. You may use the lecture notes and the te xtbook during the exam . You can also use a calculator or a laptop. If you use EXCEL to obtain a final result, you’d better write out the processes in EXCEL about how to get the final result. Show your work for each question. The logic underly ing your analysis is m ore important than the final answer . I h ave tried to leave a gen erous amount of space to answer each question. Of course, do not feel that you need to fill up all the space. When in doubt, ask. I will rarely be sym pathetic if you answer a questio n incorrectly because you misinterpreted it. Good luck! Student I.D.______________________________________ Name ____________________________________________
Applied Statistics(A).June.201 1.True of False?(10 Points,Ifor each) (1)nANOVAmn-rouvariatio is True ☐False (2)The distribution of the F test statistic is symmetrical OTrue False (3)values used when computing confidence intervals for the pro porion vary by degrees of freedon ☐True☐False (4)One should reachthe same conclusions in the conduct of a hypothesistest,regardless of whether one is using the critical-value approach,or the p-value approach to hypothesis testing. OTrue False (5)Ifthe m ean of a num erical datasetexcee dsthe median,the dat aaree onsideredtobe left-skewed ☐True☐False (6)variable may take any value within an interval depen dingonthe of the me asuring instrument True ■False (7)A tire manufacturer found as ample of tires cr eated using a new formulation resulted in an average of forty-thousand miles per tire,and concluded that they can safely advertise this finding represents the b True ☐False (8)The coefficient of variation(CV)measures the variability in a data set relative to the size of the median True False (9)Theuniform distribution is wid ely usedin wait ing-line theory tomodel the length oftime between arrivals in processes such as customers at a bank's ATM,and callers to a phone helpline. 口True口False (10)The central limit the orem ensures th at th esa mpling dis tribution oft he sam ple mean e ofa normal distribution as the ☐Fas 2.Multiple choice(30 Points,2 for each) (1)The branch of statistics that collects,summarizes,and presents data is known as: A.Sampling B. Descriptive statistics. C.Inferential statistics.D. Total quality management. (2)What type of chart is recommendedtoillustrate categorized responses plotted in descending order according to their frequencies? A.the pie chart B the Pareto Diagram
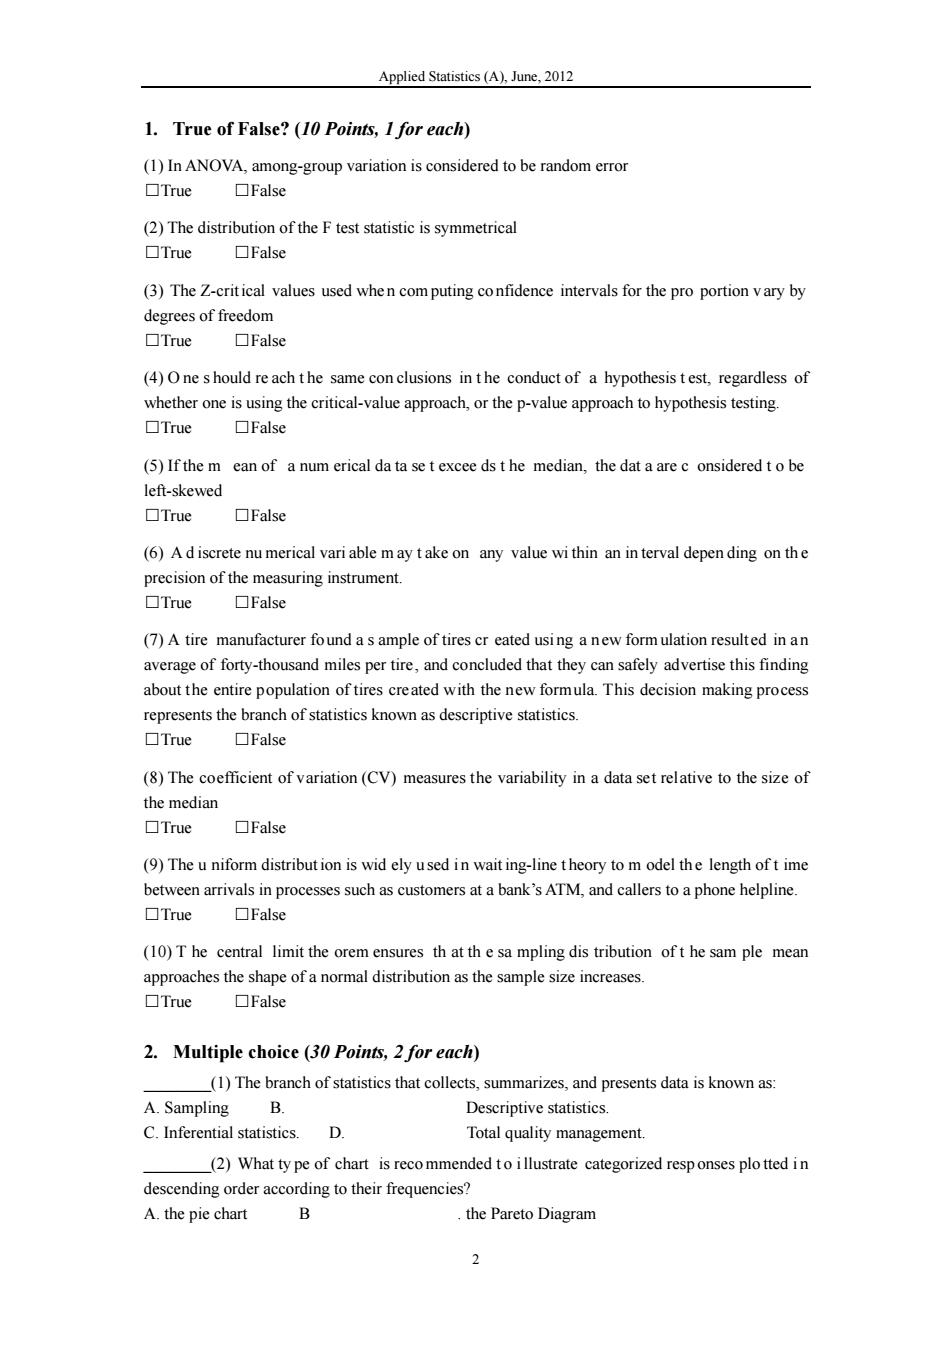
Applied Statistics (A), June, 2012 2 1. True of False? (10 Points, 1 for each) (1) In ANOVA, among-group variation is considered to be random error □True □False (2) The distribution of the F test statistic is symmetrical □True □False (3) The Z-crit ical values used whe n com puting co nfidence intervals for the pro portion v ary by degrees of freedom □True □False (4) O ne s hould re ach t he same con clusions in t he conduct of a hypothesis t est, regardless of whether one is using the critical-value approach, or the p-value approach to hypothesis testing. □True □False (5) If the m ean of a num erical da ta se t excee ds t he median, the dat a are c onsidered t o be left-skewed □True □False (6) A d iscrete nu merical vari able m ay t ake on any value wi thin an in terval depen ding on th e precision of the measuring instrument. □True □False (7) A tire manufacturer fo und a s ample of tires cr eated usi ng a n ew formulation result ed in a n average of forty-thousand miles per tire, and concluded that they can safely advertise this finding about the entire population of tires created with the new formula. This decision making process represents the branch of statistics known as descriptive statistics. □True □False (8) The coefficient of variation (CV) measures the variability in a data set relative to the size of the median □True □False (9) The u niform distribut ion is wid ely u sed i n wait ing-line t heory to m odel th e length of t ime between arrivals in processes such as customers at a bank’s ATM, and callers to a phone helpline. □True □False (10) T he central limit the orem ensures th at th e sa mpling dis tribution of t he sam ple mean approaches the shape of a normal distribution as the sample size increases. □True □False 2. Multiple choice (30 Points, 2 for each) ________(1) The branch of statistics that collects, summarizes, and presents data is known as: A. Sampling B. Descriptive statistics. C. Inferential statistics. D. Total quality management. ________(2) What ty pe of chart is reco mmended t o i llustrate categorized resp onses plo tted i n descending order according to their frequencies? A. the pie chart B . the Pareto Diagram
Applied Statistics(A).June.01 2.(cont.) C.the bar chart D the stem-and-leaf display A.the mean. B.the mode C.the median D.the variance (4)The conditional probability of event B has occured is given by A.P(A and B)/P(B) B.P(Aand B)/P(A). C.P(A or BVP(B). D.P(A and B)WP(B and A)】 (5)The collection of all possible events is called A.the null set.B.a simple probability. C.a sample space. D.a joint probability. (6)Whic hof th e foll owing is a trues tatement abo ut the binomial pro bability distribution? A.The random variable of interest is C.Each outcome can be classified as either a success,a failure,or a neutral outcome D.The probability of a success must be constant from one trial to the next trial. (7)The sum of the cross-products between values ofat their respective probabilities. P(X),is equal to the A.median. B.variance. C.expected value. D.none of the above (8)The standard error of the mean is equal to: A.the population standard deviation divided by the sample size n. B.the population variance divided by the sample size n-1. C.the population variance divided by the square root of n. D.the population standard deviation divided by the square roo ofn (9)The z-value that is used to construct a 95%confidence interval is: A1.96 B.2.58 C128 D165 (10)Which of the following statements is false? A.There isa different z-value(iecritical value)used for each level of alpha C.It is possible to construct a0%confidence interval estimate for the population mean. D.Alpha is the proportion in the tai ls of the d istribution which are outs ide of the confidence interval. (11)Each of the following are true with respect to Hypothesis testing except for: A.by failing to reject the null hypothesis,one has not proven that the alternative hypothesis is correct B.ifthe nu hypothesis is not rejected,it does not mean thenull istrue D.there are no exceptions,because all of the statements above are true. (1)Ifan individual nul ypothesis,then sh/he has A.made a Type Il erro B.made a decision to reject the nul hypothesis C.increased the power of a statistical test. D.made a Type I error. (13)If the p-value is greater than alpha in a two-tailed test A.a one-tailed test should be used. B.alpha should be changed
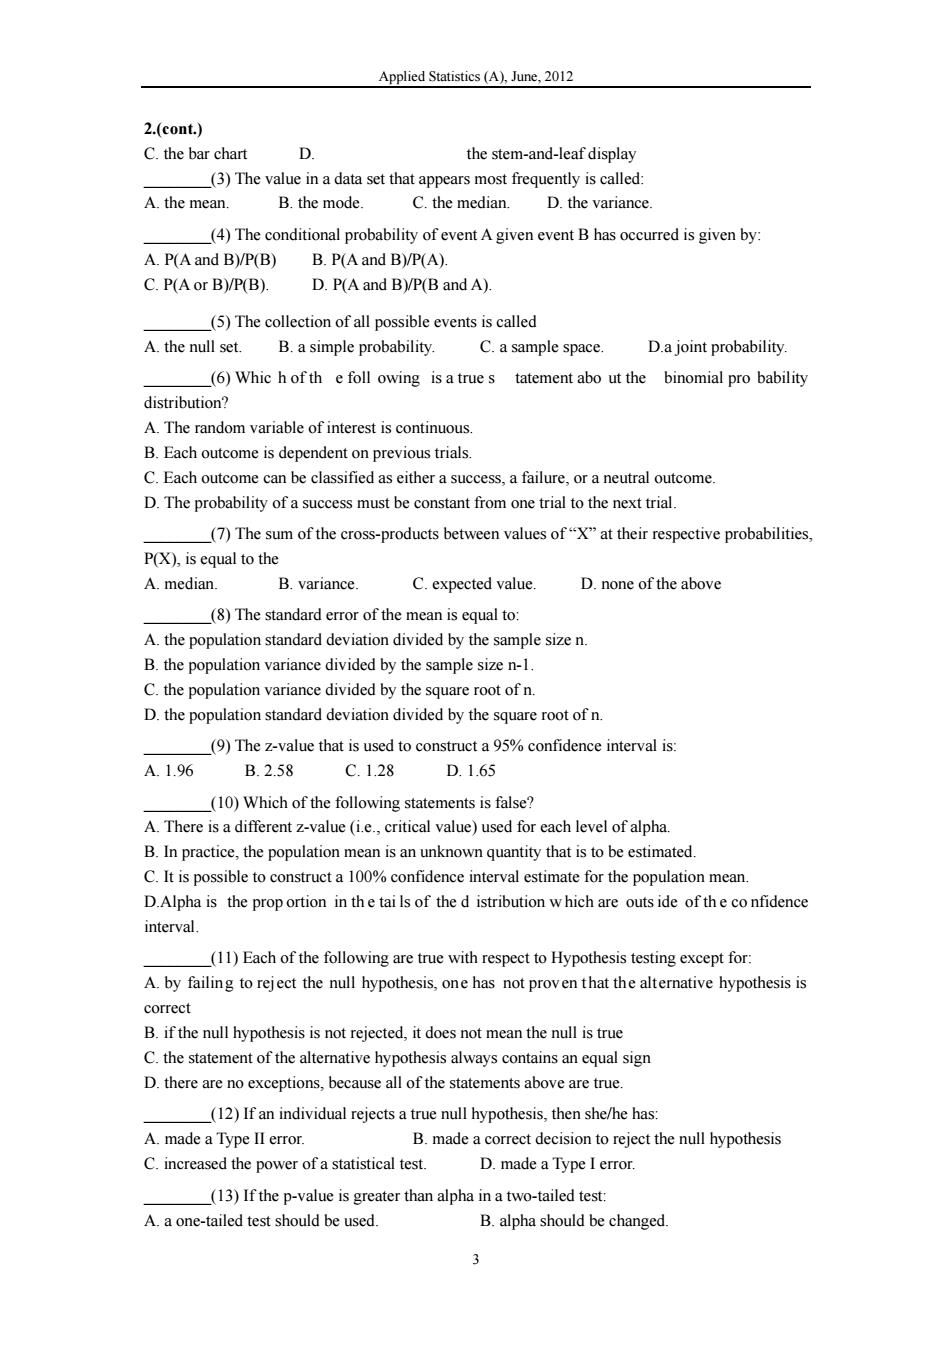
Applied Statistics (A), June, 2012 3 2.(cont.) C. the bar chart D. the stem-and-leaf display ________(3) The value in a data set that appears most frequently is called: A. the mean. B. the mode. C. the median. D. the variance. ________(4) The conditional probability of event A given event B has occurred is given by: A. P(A and B)/P(B) B. P(A and B)/P(A). C. P(A or B)/P(B). D. P(A and B)/P(B and A). ________(5) The collection of all possible events is called A. the null set. B. a simple probability. C. a sample space. D.a joint probability. ________(6) Whic h of th e foll owing is a true s tatement abo ut the binomial pro bability distribution? A. The random variable of interest is continuous. B. Each outcome is dependent on previous trials. C. Each outcome can be classified as either a success, a failure, or a neutral outcome. D. The probability of a success must be constant from one trial to the next trial. ________(7) The sum of the cross-products between values of “X” at their respective probabilities, P(X), is equal to the A. median. B. variance. C. expected value. D. none of the above ________(8) The standard error of the mean is equal to: A. the population standard deviation divided by the sample size n. B. the population variance divided by the sample size n-1. C. the population variance divided by the square root of n. D. the population standard deviation divided by the square root of n. ________(9) The z-value that is used to construct a 95% confidence interval is: A. 1.96 B. 2.58 C. 1.28 D. 1.65 ________(10) Which of the following statements is false? A. There is a different z-value (i.e., critical value) used for each level of alpha. B. In practice, the population mean is an unknown quantity that is to be estimated. C. It is possible to construct a 100% confidence interval estimate for the population mean. D.Alpha is the prop ortion in th e tai ls of the d istribution w hich are outs ide of th e co nfidence interval. ________(11) Each of the following are true with respect to Hypothesis testing except for: A. by failing to reject the null hypothesis, one has not proven that the alternative hypothesis is correct B. if the null hypothesis is not rejected, it does not mean the null is true C. the statement of the alternative hypothesis always contains an equal sign D. there are no exceptions, because all of the statements above are true. ________(12) If an individual rejects a true null hypothesis, then she/he has: A. made a Type II error. B. made a correct decision to reject the null hypothesis C. increased the power of a statistical test. D. made a Type I error. ________(13) If the p-value is greater than alpha in a two-tailed test: A. a one-tailed test should be used. B. alpha should be changed
Applied Statistics (A).June.201 C.the null hypothesis should be rejected. D.the null hypothesis should not be rejected. (14)When testing the hypothesis using interval estimate of th difference between two means,one would reject the null hypothesis when A.the lower confidence limit is less than zero B.the upper confidence limit is greater than zero C.the confidence interval does not include zero D.the confidence interval includeszer (15)The one-way ANOVA is used to test statistical hypotheses concerning: A.standard deviations.B.variances.C.group means.D.mean squares. 3.()A municipal bond service has three rating categories(A.B.and C).Suppose that in the past year of the tedA.20% were rated B.%were rated C.Ofthe municipal bonds rated A.5%were issued by cities 40%by suburbs,and 10%by rural areas.Of the municipal bonds rated B.60%were issued by cities,20%by suburbs,and 20%by rural areas.Ofthe municipal bonds rated C%were issued by cities.5%by suburbs.and 5%by rural areas. (1)ifanew municipal bond is to be issued by acity.what is the probability that it will receive an A rating? (2)What proportion of municipal bonds is issued by cities?
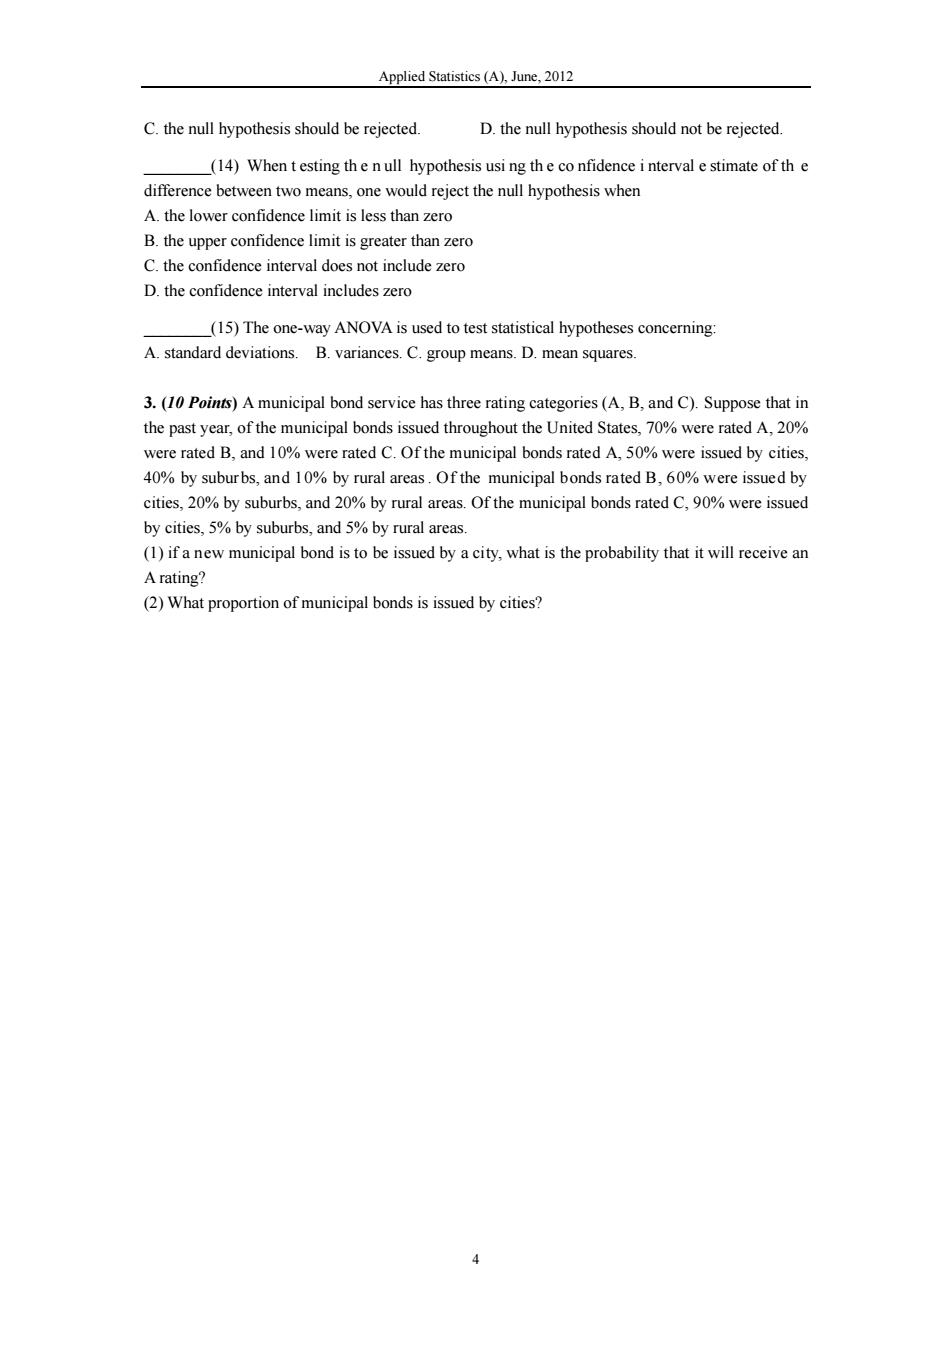
Applied Statistics (A), June, 2012 4 C. the null hypothesis should be rejected. D. the null hypothesis should not be rejected. ________(14) When t esting th e n ull hypothesis usi ng th e co nfidence i nterval e stimate of th e difference between two means, one would reject the null hypothesis when A. the lower confidence limit is less than zero B. the upper confidence limit is greater than zero C. the confidence interval does not include zero D. the confidence interval includes zero ________(15) The one-way ANOVA is used to test statistical hypotheses concerning: A. standard deviations. B. variances. C. group means. D. mean squares. 3. (10 Points) A municipal bond service has three rating categories (A, B, and C). Suppose that in the past year, of the municipal bonds issued throughout the United States, 70% were rated A, 20% were rated B, and 10% were rated C. Of the municipal bonds rated A, 50% were issued by cities, 40% by suburbs, and 10% by rural areas . Of the municipal bonds rated B, 60% were issued by cities, 20% by suburbs, and 20% by rural areas. Of the municipal bonds rated C, 90% were issued by cities, 5% by suburbs, and 5% by rural areas. (1) if a new municipal bond is to be issued by a city, what is the probability that it will receive an A rating? (2) What proportion of municipal bonds is issued by cities?
Applied Statistics(A).June.2012 4.(10 Points)Aset of final examination grades in an introductory statistics course was fo und to benormally distributed.ith amean a standard deviationof (2)Only%of the students taking the test scored higher than what grade
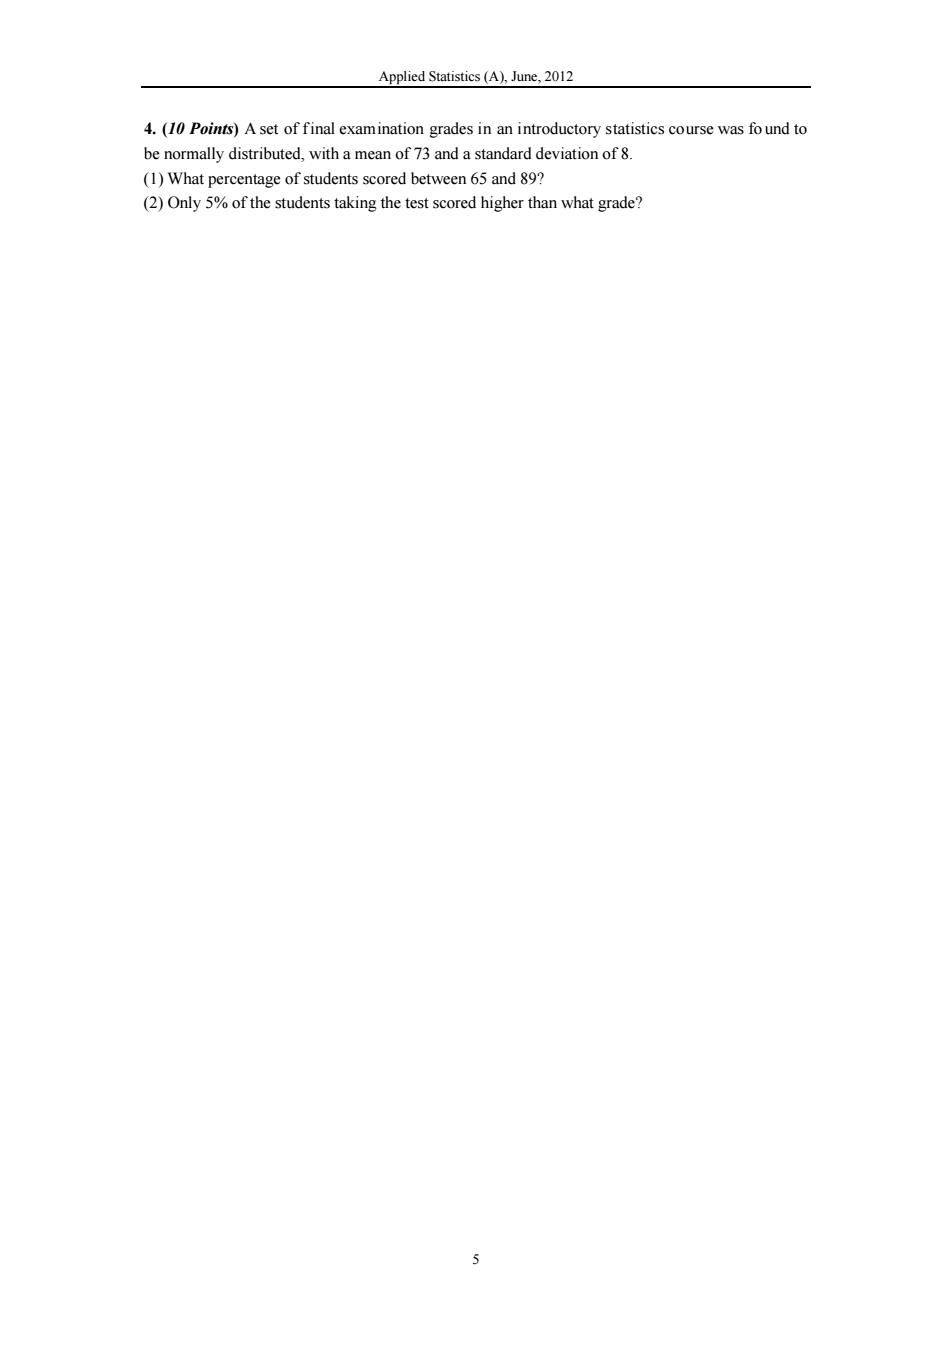
Applied Statistics (A), June, 2012 5 4. (10 Points) A set of f inal examination grades in an introductory statistics course was fo und to be normally distributed, with a mean of 73 and a standard deviation of 8. (1) What percentage of students scored between 65 and 89? (2) Only 5% of the students taking the test scored higher than what grade?