
Statistics for Managers using Microsoft®E Excel Chapter 3 Numerical Descriptive Measures Statistics for Ma nagers Using Microsoft Excel Chap 3-1
Statistics for Managers Using Microsoft Excel Chap 3-1 Statistics for Managers using Microsoft® Excel Chapter 3 Numerical Descriptive Measures

Learning Objectives In this chapter,you will learn: >To describe the properties of central tendency, variation and shape in numerical data To calculate descriptive summary measures for a population To construct and interpret a box-and-whisker plot >To describe the covariance and coefficient of correlation as a measure of the strength of the relationship between two numerical variables Statistics for Managers Using Microsoft Excel Chap 3-2
Statistics for Managers Using Microsoft Excel Chap 3-2 Learning Objectives In this chapter, you will learn: To describe the properties of central tendency, variation and shape in numerical data To calculate descriptive summary measures for a population To construct and interpret a box-and-whisker plot To describe the covariance and coefficient of correlation as a measure of the strength of the relationship between two numerical variables
Summary Definitions >The central tendency is the extent to which all the data values group around a typical or central value. >The variation is the amount of dispersion,or scattering,of values >The shape is the pattern of the distribution of values from the lowest value to the highest value. Statistics for Ma nagers Using Microsoft Excel Chap 3-3
Statistics for Managers Using Microsoft Excel Chap 3-3 Summary Definitions The central tendency is the extent to which all the data values group around a typical or central value. The variation is the amount of dispersion, or scattering, of values The shape is the pattern of the distribution of values from the lowest value to the highest value

Chapter Topics Measures of central tendency Mean,median,mode,geometric mean ■Quartile ■Measure of variation Range,interquartile range,variance and standard deviation,coefficient of variation Shape Symmetric,skewed,using box-and-whisker plots Covariance and Coefficient of correlation Statistics for Mar nagers Using Microsoft Excel Chap 3-4
Statistics for Managers Using Microsoft Excel Chap 3-4 Chapter Topics Measures of central tendency Mean, median, mode, geometric mean Quartile Measure of variation Range, interquartile range, variance and standard deviation, coefficient of variation Shape Symmetric, skewed, using box-and-whisker plots Covariance and Coefficient of correlation
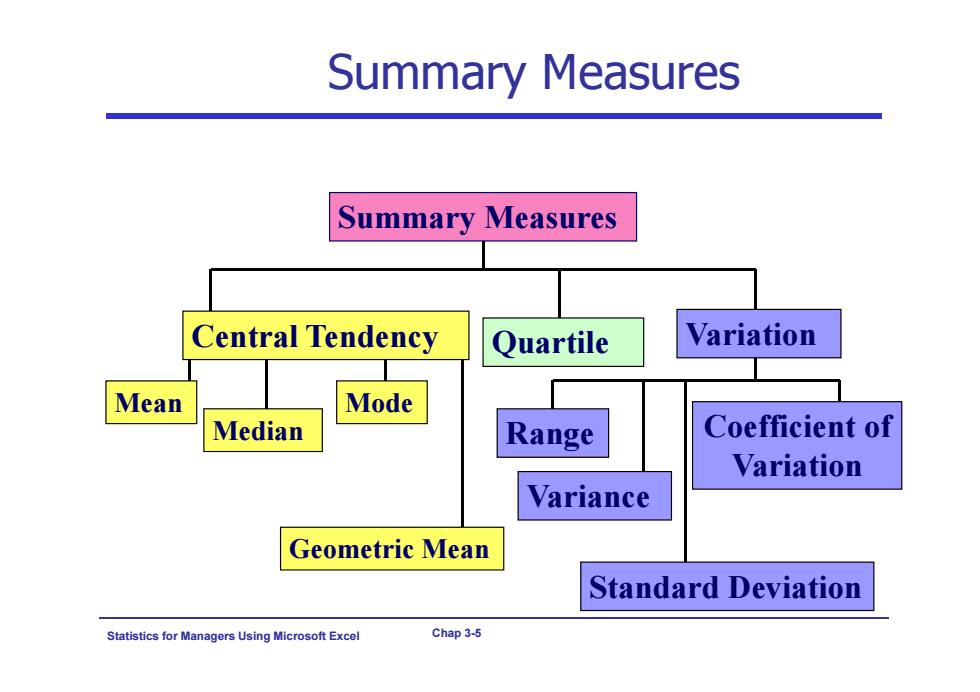
Summary Measures Summary Measures Central Tendency Quartile Variation Mean Mode Median Range Coefficient of Variation Variance Geometric Mean Standard Deviation Statistics for Ma nagers Using Microsoft Excel Chap 3-5
Statistics for Managers Using Microsoft Excel Chap 3-5 Summary Measures Central Tendency Mean Median Mode Quartile Geometric Mean Summary Measures Variation Variance Standard Deviation Coefficient of Variation Range