
Statistics for Managers Using Microsoft Excel Chapter 5 Some Important Discrete Probability Distributions Statistics for Managers Using Microsoft Excel Chap 5-1
Statistics for Managers Using Microsoft Excel Chap 5-1 Chapter 5 Some Important Discrete Probability Distributions Statistics for Managers Using Microsoft® Excel
Chapter Goals After completing this chapter,you should be able to: Interpret the mean and standard deviation for a discrete probability distribution ■ Explain covariance and its application in finance Use the binomial probability distribution to find probabilities Describe when to apply the binomial distribution Discuss the Hypergeometric distribution Review the Poisson distribution Chap 5-2 Tongji University School of Economics&Management Statistics for Managers Using Microsoft Excel
Statistics for Managers Using Microsoft Excel Chap 5-2 Tongji University School of Economics & Management Chapter Goals After completing this chapter, you should be able to: ▪ Interpret the mean and standard deviation for a discrete probability distribution ▪ Explain covariance and its application in finance ▪ Use the binomial probability distribution to find probabilities ▪ Describe when to apply the binomial distribution ▪ Discuss the Hypergeometric distribution ▪ Review the Poisson distribution

Introduction to Probability Distributions Random Variable Represents a possible numerical value from an uncertain event Discrete random variables produce outcomes that come from a counting process (e.g. number of classes you are taking). Continuous random variables produce outcomes that come from a measurement (e.g. your annual salary,or your weight). Chap 5-3 Tongji University School of Economics Management Statistics for Managers Using Microsoft Excel
Statistics for Managers Using Microsoft Excel Chap 5-3 Tongji University School of Economics & Management Introduction to Probability Distributions ▪ Random Variable ▪ Represents a possible numerical value from an uncertain event ▪ Discrete random variables produce outcomes that come from a counting process (e.g. number of classes you are taking). ▪ Continuous random variables produce outcomes that come from a measurement (e.g. your annual salary, or your weight)
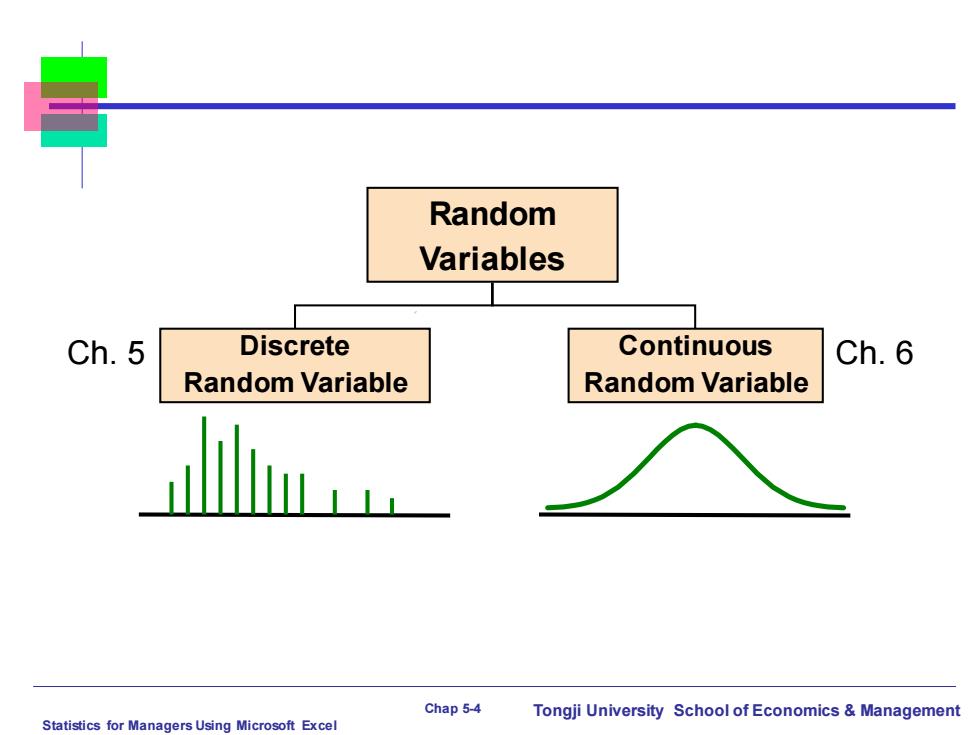
Random Variables Ch.5 Discrete Continuous Ch.6 Random Variable Random Variable Chap 5-4 Tongji University School of Economics Management Statistics for Managers Using Microsoft Excel
Statistics for Managers Using Microsoft Excel Chap 5-4 Tongji University School of Economics & Management Random Variables Discrete Random Variable Continuous Random Variable Ch. 5 Ch. 6

Discrete Random Variables Can only assume a countable number of values Examples: ■Roll a die twice Let X be the number of times 4 comes up (then X could be 0,1,or 2 times) Toss a coin 5 times. Let X be the number of heads (then X=0,1,2,3,4,or5) Chap 5-5 Tongji University School of Economics Management Statistics for Managers Using Microsoft Excel
Statistics for Managers Using Microsoft Excel Chap 5-5 Tongji University School of Economics & Management Discrete Random Variables ▪ Can only assume a countable number of values Examples: ▪ Roll a die twice Let X be the number of times 4 comes up (then X could be 0, 1, or 2 times) ▪ Toss a coin 5 times. Let X be the number of heads (then X = 0, 1, 2, 3, 4, or 5)