A Survey on Multivariate Data Visualization Winnie Wing-Yi Chan Department of Computer Science and Engineering Hong Kong University of Science and Technology Clear Water Bay,Kowloon,Hong Kong June 2006
A Survey on Multivariate Data Visualization Winnie Wing-Yi Chan Department of Computer Science and Engineering Hong Kong University of Science and Technology Clear Water Bay, Kowloon, Hong Kong June 2006
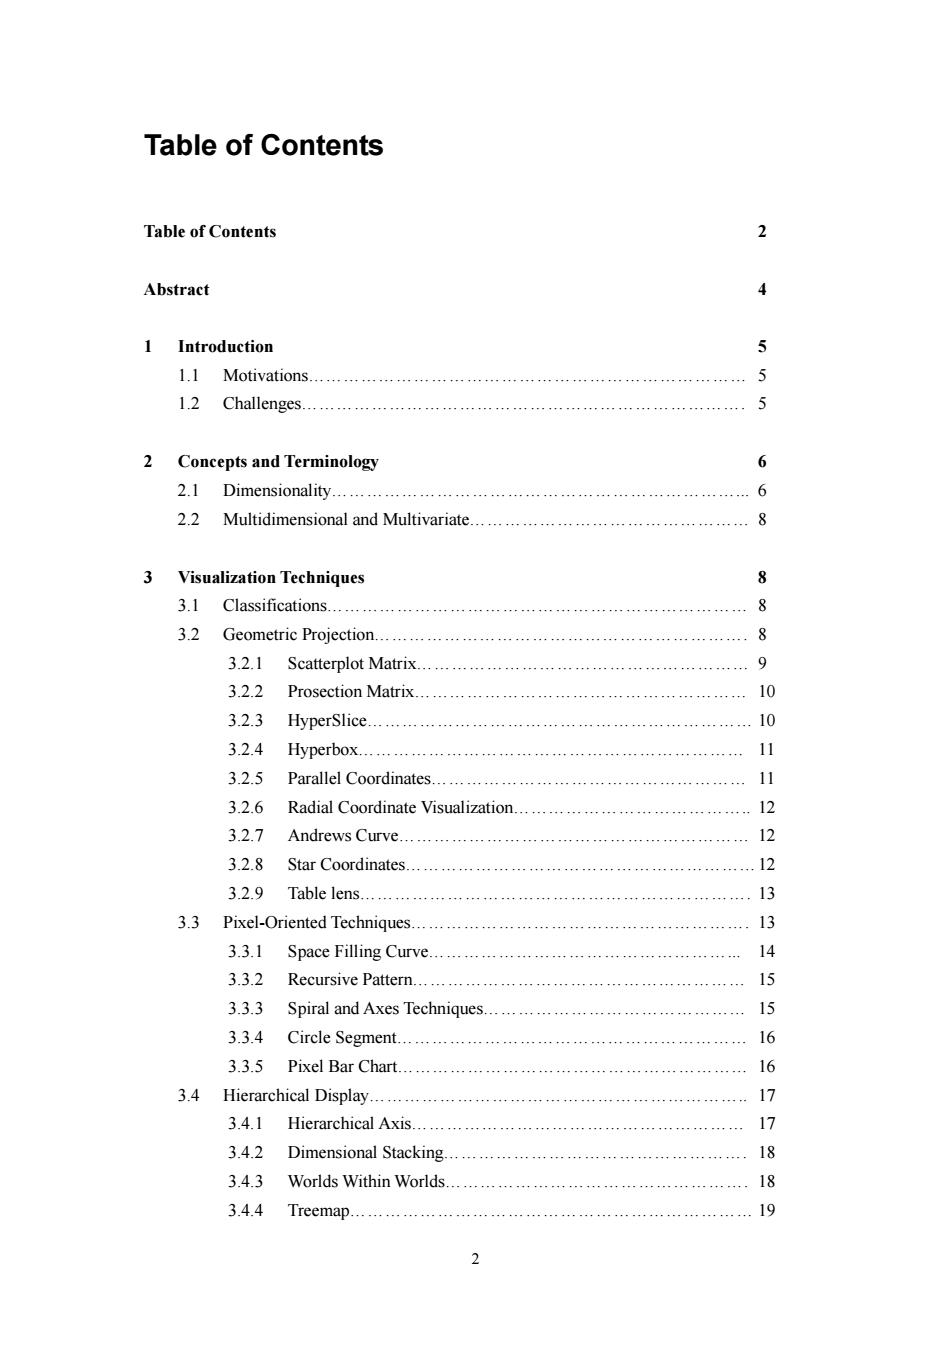
Table of Contents Table of Contents Abstract 1 Introduction 5 1.1 Motivations........... 5 1.2 Challenges...… 5 2 Concepts and Terminology 6 2.1 Dimensionality.........……… 6 2.2 Multidimensional and Multivariate....................................... 8 3 Visualization Techniques 8 3.1 Classifications.… P 3.2 Geometric Projection...... 8 3.2.1 Scatterplot Matrix.............. 9 3.2.2 Prosection Matrix 10 3.2.3 HyperSlice. 。 10 3.2.4 Hyperbox.… 11 3.2.5 Parallel Coordinates...... 11 3.2.6 Radial Coordinate Visualization.... 12 3.2.7 Andrews Curve.…… 12 3.2.8 Star Coordinates..…..…….. 2 3.2.9 Table lens.…… 13 3.3 Pixel-Oriented Techniques.................................................... 13 3.3.1 Space Filling Curve........... 14 3.3.2 Recursive Pattern................ ………………………… 15 3.3.3 Spiral and Axes Techniques. 15 3.3.4 Circle Segment.… 16 3.3.5 Pixel Bar Chart....…. 16 3.4 Hierarchical Display.… 17 3.4.1 Hierarchical Axis................ 17 3.4.2 Dimensional Stacking............................................ 18 3.4.3 Worlds Within Worlds............ 18 3.4.4 Treemap....… 19 2
2 Table of Contents Table of Contents 2 Abstract 4 1 Introduction 5 1.1 Motivations………………………………………………………………… 5 1.2 Challenges…………………………………………………………………. 5 2 Concepts and Terminology 6 2.1 Dimensionality……………………………………………………………... 6 2.2 Multidimensional and Multivariate………………………………………… 8 3 Visualization Techniques 8 3.1 Classifications……………………………………………………………… 8 3.2 Geometric Projection………………………………………………………. 8 3.2.1 Scatterplot Matrix………………………………………………… 9 3.2.2 Prosection Matrix………………………………………………… 10 3.2.3 HyperSlice………………………………………………………… 10 3.2.4 Hyperbox………………………………………………………… 11 3.2.5 Parallel Coordinates……………………………………………… 11 3.2.6 Radial Coordinate Visualization………………………………….. 12 3.2.7 Andrews Curve…………………………………………………… 12 3.2.8 Star Coordinates……………………………………………………12 3.2.9 Table lens…………………………………………………………. 13 3.3 Pixel-Oriented Techniques…………………………………………………. 13 3.3.1 Space Filling Curve……………………………………………... 14 3.3.2 Recursive Pattern………………………………………………… 15 3.3.3 Spiral and Axes Techniques……………………………………… 15 3.3.4 Circle Segment…………………………………………………… 16 3.3.5 Pixel Bar Chart…………………………………………………… 16 3.4 Hierarchical Display……………………………………………………….. 17 3.4.1 Hierarchical Axis………………………………………………… 17 3.4.2 Dimensional Stacking……………………………………………. 18 3.4.3 Worlds Within Worlds……………………………………………. 18 3.4.4 Treemap…………………………………………………………… 19
3.5 Iconography 19 3.5.1 Chernoff Faces 19 3.5.2 Star Glyph......... 20 3.5.3 Stick Figure….… 20 3.5.4 Shape Coding. 21 3.5.5 Color Icon..… …………………………… 21 3.5.6 Texture.… 22 4 Discussion and Conclusion 25 Bibliography 26
3 3.5 Iconography………………………………………………………………… 19 3.5.1 Chernoff Faces……………………………………………………..19 3.5.2 Star Glyph………………………………………………………… 20 3.5.3 Stick Figure……………………………………………………….. 20 3.5.4 Shape Coding…………………………………………………….. 21 3.5.5 Color Icon………………………………………………………… 21 3.5.6 Texture……………………………………………………………. 22 4 Discussion and Conclusion 25 Bibliography 26
Abstract Multivariate data visualization,as a specific type of information visualization,is an active research field with numerous applications in diverse areas ranging from science communities and engineering design to industry and financial markets,in which the correlations between many attributes are of vital interest. In this survey,we will first review the motivations and challenges of multivariate data visualization.In section 2,a brief terminology is introduced.Some established techniques for multivariate data visualization are described in section 3.These techniques are classified into several categories to provide a basic taxonomy of the field.At the end of this survey,we will discuss some future research directions
4 Abstract Multivariate data visualization, as a specific type of information visualization, is an active research field with numerous applications in diverse areas ranging from science communities and engineering design to industry and financial markets, in which the correlations between many attributes are of vital interest. In this survey, we will first review the motivations and challenges of multivariate data visualization. In section 2, a brief terminology is introduced. Some established techniques for multivariate data visualization are described in section 3. These techniques are classified into several categories to provide a basic taxonomy of the field. At the end of this survey, we will discuss some future research directions
1.Introduction 1.1 Motivations While information is growing in an exponential way,our world is flooded with data which, we believe,should contain some kind of valuable information that can possibly expand the human knowledge.However,extracting the meaningful information is a difficult task when large quantities of data are presented in plain text or traditional tabular form.Effective graphical representations of the data thus enjoy popularity by harnessing the human's visual perception capabilities. Information visualization is the use of computer-based interactive visual representations of abstract and non-physically based data to amplify human cognition.It aims at helping users to effectively detect and explore the expected,as well as discovering the unexpected to gain insight into the data.For multivariate data visualization,the dataset to be visually analyzed is of high dimensionality and these attributes are correlated in some way. Multivariate data are encountered in all aspects by researchers,scientists,engineers, manufacturers,financial managers and various kinds of analysts.Multivariate data visualization is hence strongly motivated by the many situations when they are trying to obtain an integrated understanding of the data distributions and investigate the inter-relationships between different data attributes.Such an effective visual display tool is demanded to facilitate users to identify,locate,distinguish,categorize,cluster,rank,compare, associate or correlate the underlying data [3]. 1.2 Challenges Multivariate data visualization faces the same challenges as information visualization does: Finding good visual representations of a problem can be hard and undeterministic.In addition, multivariate data poses problems in encoding its attributes in a single visual display. Mapping.Finding a suitable mapping of high-dimensional multivariate data into a 2D visual form is never a simple task.It usually depends on the nature of datasets to be visualized and is more related to human perception.Also,association of data attributes to graphical entities requires extreme caution to avoid overwhelming the observer's viewing ability.Conjunction of several elements in the representations may induce cognition overload to the users [6]and graphical attributes should therefore be carefully selected such that they are easy to untangle.It is important that different attributes can be viewed holistically for integrated analysis and,at the same time,each dimension can be judged by users separately and independently
5 1. Introduction 1.1 Motivations While information is growing in an exponential way, our world is flooded with data which, we believe, should contain some kind of valuable information that can possibly expand the human knowledge. However, extracting the meaningful information is a difficult task when large quantities of data are presented in plain text or traditional tabular form. Effective graphical representations of the data thus enjoy popularity by harnessing the human’s visual perception capabilities. Information visualization is the use of computer-based interactive visual representations of abstract and non-physically based data to amplify human cognition. It aims at helping users to effectively detect and explore the expected, as well as discovering the unexpected to gain insight into the data. For multivariate data visualization, the dataset to be visually analyzed is of high dimensionality and these attributes are correlated in some way. Multivariate data are encountered in all aspects by researchers, scientists, engineers, manufacturers, financial managers and various kinds of analysts. Multivariate data visualization is hence strongly motivated by the many situations when they are trying to obtain an integrated understanding of the data distributions and investigate the inter-relationships between different data attributes. Such an effective visual display tool is demanded to facilitate users to identify, locate, distinguish, categorize, cluster, rank, compare, associate or correlate the underlying data [3]. 1.2 Challenges Multivariate data visualization faces the same challenges as information visualization does: Finding good visual representations of a problem can be hard and undeterministic. In addition, multivariate data poses problems in encoding its attributes in a single visual display. Mapping. Finding a suitable mapping of high-dimensional multivariate data into a 2D visual form is never a simple task. It usually depends on the nature of datasets to be visualized and is more related to human perception. Also, association of data attributes to graphical entities requires extreme caution to avoid overwhelming the observer’s viewing ability. Conjunction of several elements in the representations may induce cognition overload to the users [6] and graphical attributes should therefore be carefully selected such that they are easy to untangle. It is important that different attributes can be viewed holistically for integrated analysis and, at the same time, each dimension can be judged by users separately and independently