
A.GDP measures both an economy's total income and its total expenditure on goods and services. B.GDP per person tells us the income and expenditure level of the average person in the economy C.GDP,however,may not be a very good measure of the economic well-being of an individual. 1.GDP omits important factors in the quality of life including leisure,the quality of the environment,and the value of goods produced but not sold in formal markets. 2.GDP also says nothing about the distribution of income 3.However,a higher GDP does help us achieve a good life.Nations with larger GDP generally have better education and better health care. D.In the News:The Underground Economy 1. The measurement of GDP misses many transactions that take place in the underground economy 2.This article compares the underground economies of the United States and several other countries E.Case Srudy:International Differences in GDP and the Quality of Life 1.Table 3 shows real GDP per person,life expectancy,adult literacy rates,and Internet usage for 12 countries. rates are also high. 3.In poor countries,people typically live only into their 50s,only about half of the adult population is literate,and Internet usage is very rare. (三)思政设计 从国家统计公报、国际MF组织等网站报告链接、权威GDP等数据导入开始
11 A. GDP measures both an economy’s total income and its total expenditure on goods and services. B. GDP per person tells us the income and expenditure level of the average person in the economy. C. GDP, however, may not be a very good measure of the economic well-being of an individual. 1. GDP omits important factors in the quality of life including leisure, the quality of the environment, and the value of goods produced but not sold in formal markets. 2. GDP also says nothing about the distribution of income. 3. However, a higher GDP does help us achieve a good life. Nations with larger GDP generally have better education and better health care. D. In the News: The Underground Economy 1. The measurement of GDP misses many transactions that take place in the underground economy. 2. This article compares the underground economies of the United States and several other countries. E. Case Study: International Dif erences in GDP and the Quality of Life 1. Table 3 shows real GDP per person, life expectancy, adult literacy rates, and Internet usage for 12 countries. 2. In rich countries, life expectancy is higher and adult literacy and Internet usage rates are also high. 3. In poor countries, people typically live only into their 50s, only about half of the adult population is literate, and Internet usage is very rare. (三)思政设计 从国家统计公报、国际 IMF 组织等网站报告链接、权威 GDP 等数据导入开始
了解中国与国际经济形势,中国GDP的变化。复习提问GDP概念、核算方法。使得 学生不仅意识到中国改革开放后巨大成就,增强“道路自信”,而且了解和重视高质量 发展。通过理论实践比对,加深对知识的了解,夯实基础知识。 (四)课后练习 1.Explain why an economy's income must equal its expenditure 2.Which contributes more to GDP-the production of an economy car or the production of a luxury car?Why? 3.A farmer sells wheat to a baker for $2.The baker uses the wheat to make bread,which is sold for $3.What is the total contribution of these transactions to GDP? 4.Many years ago,Pegey y,she sold 5.List the four components of GDP.Give an example of each. (五)教学方法与手段 本章教学主要采用课堂讲授、多媒体教学、分组讨论、课堂讨论等。 12
12 了解中国与国际经济形势,中国 GDP 的变化。复习提问 GDP 概念、核算方法。使得 学生不仅意识到中国改革开放后巨大成就,增强“道路自信”,而且了解和重视高质量 发展。通过理论实践比对,加深对知识的了解,夯实基础知识。 (四)课后练习 1. Explain why an economy’s income must equal its expenditure. 2. Which contributes more to GDP—the production of an economy car or the production of a luxury car? Why? 3. A farmer sells wheat to a baker for $2. The baker uses the wheat to make bread, which is sold for $3. What is the total contribution of these transactions to GDP? 4. Many years ago, Peggy paid $500 to put together a record collection. Today, she sold her albums at a garage sale for $100. How does this sale affect current GDP? 5. List the four components of GDP. Give an example of each. (五)教学方法与手段 本章教学主要采用课堂讲授、多媒体教学、分组讨论、课堂讨论等

第二十四章Measuring the Cost of Living (一)目的与要求 Chapter 24 is the second chapter of a two-chapter sequence that deals with how economists measure output and prices in the macroeconomy.Chapter 23 addressed how economists measure output.Chapter 24 develops how economists measure the overall price level in the macroeconomy. The purpose of Chapter 24 is twofold:first,to show you how to generate a price index and,second,to teach you how to employ a price index to compare dollar figures from different points in time and to adjust interest rates for inflation.In addition,you will learn some of the shortcomings of using the consumer price index as a measure of the cost of living.In this chapter,students should understand: how the consumer price index(CPI)is constructed 2.why the CPI is an imperfect measure of the cost of living. 3.how to compare the CPI and the GDP deflator as measures of the overall price level 4.how to use a price index toc ompare dollar figures from different times 5. the distinction between real and nominal interest rates (仁)教学内容 I.The Consumer Price Index A.Definition of consumer price index (CPD):a measure of the overall cost of the goods s and s services bought by a typical consumer B.How the Consumer Price Index Is Calculated ab咖1 1.Fix the basket a.The Bureau of Labor Statistics uses surveys to determine a representative bundle of goods and services purchased by a typical consumer. b.Example:4 hot dogs and 2 hamburgers 2.Find the prices. 13
13 第二十四章 Measuring the Cost of Living (一) 目的与要求 Chapter 24 is the second chapter of a two-chapter sequence that deals with how economists measure output and prices in the macroeconomy. Chapter 23 addressed how economists measure output. Chapter 24 develops how economists measure the overall price level in the macroeconomy. The purpose of Chapter 24 is twofold: first, to show you how to generate a price index and, second, to teach you how to employ a price index to compare dollar figures from different points in time and to adjust interest rates for inflation. In addition, you will learn some of the shortcomings of using the consumer price index as a measure of the cost of living. In this chapter, students should understand: 1. how the consumer price index (CPI) is constructed. 2. why the CPI is an imperfect measure of the cost of living. 3. how to compare the CPI and the GDP deflator as measures of the overall price level. 4. how to use a price index to compare dollar figures from different times. 5. the distinction between real and nominal interest rates. (二) 教学内容 I. The Consumer Price Index A. Definition of consumer price index (CPI): a measure of the overall cost of the goods and services bought by a typical consumer. B. How the Consumer Price Index Is Calculated 1. Fix the basket. a. The Bureau of Labor Statistics uses surveys to determine a representative bundle of goods and services purchased by a typical consumer. b. Example: 4 hot dogs and 2 hamburgers. 2. Find the prices
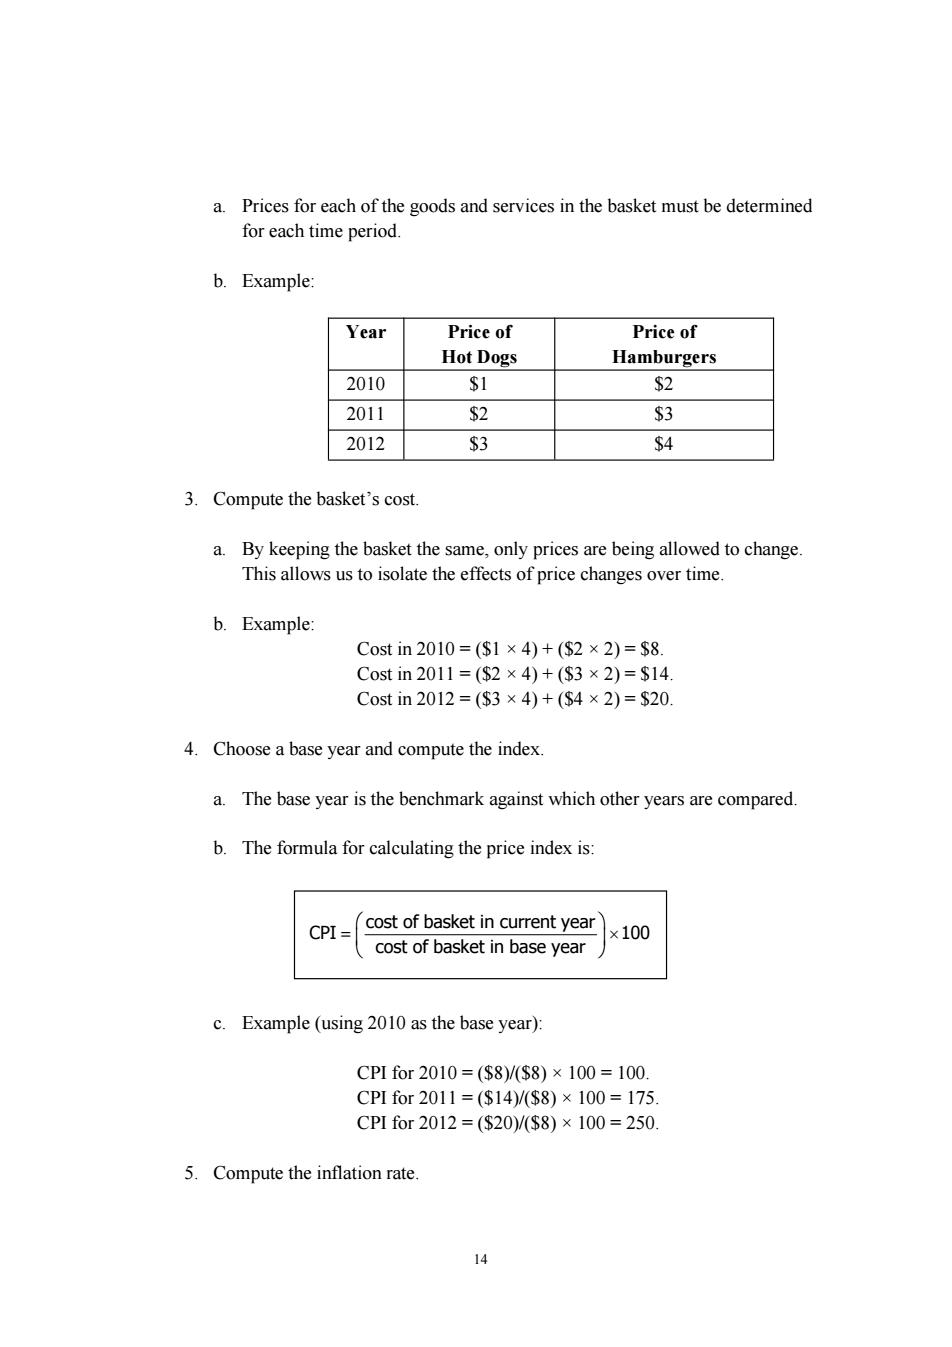
a.Prices for each of the goods and services in the basket must be determined for each time period. b. Example Year Price of Price of Hot Dogs Hamburgers 2010 $2 2011 $2 $3 2012 S3 $4 3.Compute the basket's cost. a.By keeping the basket the same,only prices are being allowed to change This allows us to isolate the effects of price changes over time b.Example Cost in2010=(S1×4)+(S2×2)=$8 Cost in2011=($2×4)+(③3×2)=$14 Cost in2012=($3×4)+($4×2)=$20 4.Choose a base year and compute the index a.The base year is the benchmark against which other years are compared. b The formula for calculating the price index is Icost of basket in current year0 cost of basket in base year c.Example(using 2010 as the base year) CPI for2010=(S8)/($8)×100=100. CPI for2011=(S14)/($8)×100=175 CPI for2012=(s20)V/$8)×100=250 5.Compute the inflation rate. 14
14 a. Prices for each of the goods and services in the basket must be determined for each time period. b. Example: Year Price of Hot Dogs Price of Hamburgers 2010 $1 $2 2011 $2 $3 2012 $3 $4 3. Compute the basket’s cost. a. By keeping the basket the same, only prices are being allowed to change. This allows us to isolate the effects of price changes over time. b. Example: Cost in 2010 = ($1 × 4) + ($2 × 2) = $8. Cost in 2011 = ($2 × 4) + ($3 × 2) = $14. Cost in 2012 = ($3 × 4) + ($4 × 2) = $20. 4. Choose a base year and compute the index. a. The base year is the benchmark against which other years are compared. b. The formula for calculating the price index is: cost of basket in current year CPI 100 cost of basket in base year c. Example (using 2010 as the base year): CPI for 2010 = ($8)/($8) × 100 = 100. CPI for 2011 = ($14)/($8) × 100 = 175. CPI for 2012 = ($20)/($8) × 100 = 250. 5. Compute the inflation rate
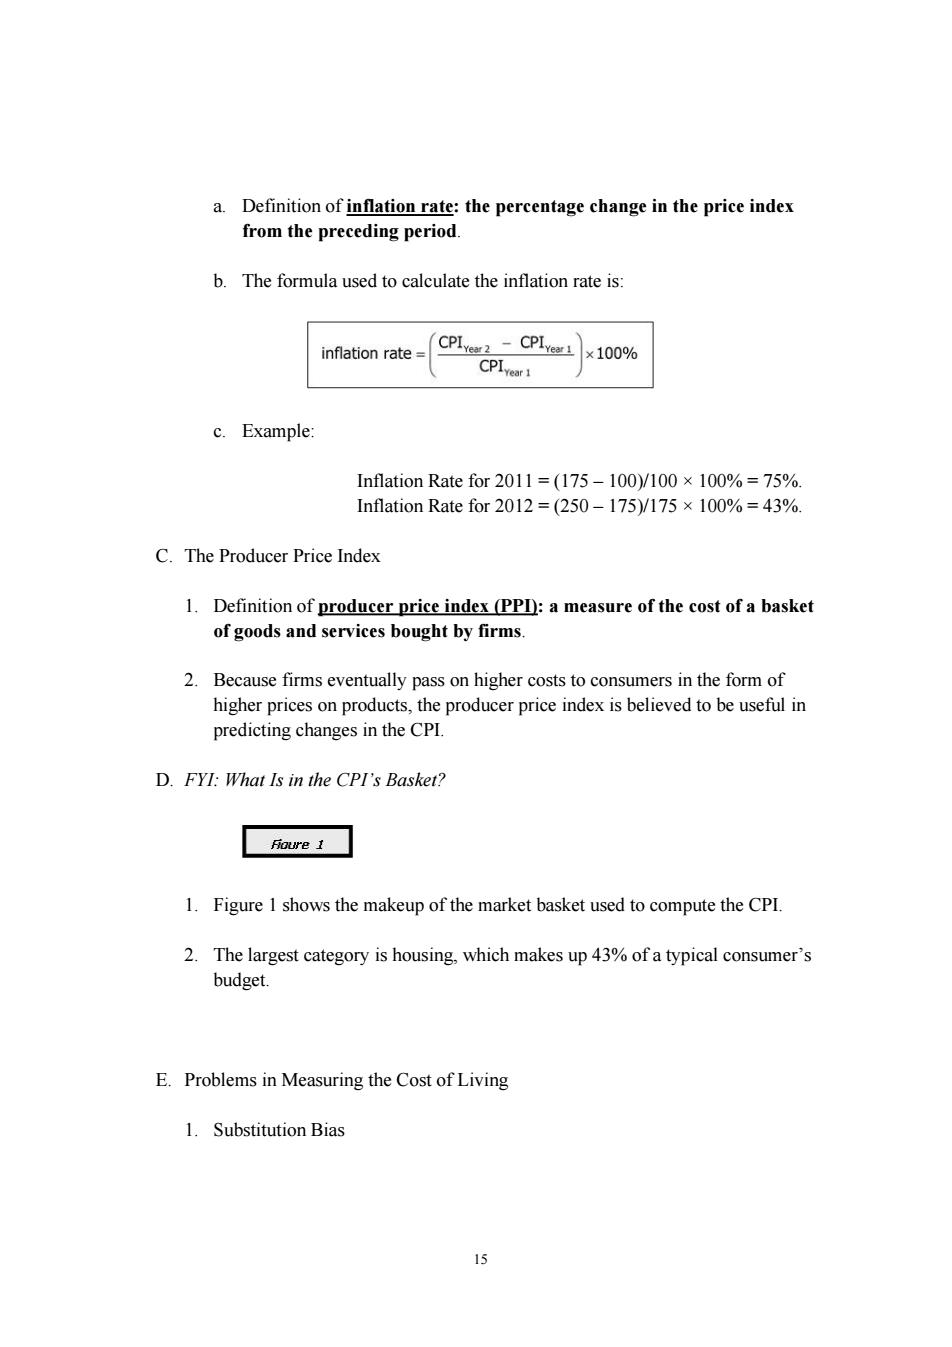
a.Definition of inflation rate:the percentage change in the price index from the preceding period. b.The formula used to calculate the inflation rate is inflation rate=CPI CPI c.Example: Inflation Rate for2011=(175-100)/100×100%=75%. Inf1 ation Rate for2012=250-175)/175×100%=43% C.The Producer Price Index 1.Definition of producer price index (PPD):a measure of the cost of a basket of goods and services bought by firms 2.Because firms eventually pass on higher costs to consumers in the form of higher prices on products,the producer price index is believed to be useful in predicting changes in the CPI. D.FYI:What Is in the CPI's Basket? E1☐ 1.Figure I shows the makeup of the market basket used to compute the CPI. 2.The largest category is housing.which makes up43%of a typical consumer's budget. E.Problems in Measuring the Cost of Living 1.Substitution Bias 15
15 a. Definition of inflation rate: the percentage change in the price index from the preceding period. b. The formula used to calculate the inflation rate is: c. Example: Inflation Rate for 2011 = (175 – 100)/100 × 100% = 75%. Inflation Rate for 2012 = (250 – 175)/175 × 100% = 43%. C. The Producer Price Index 1. Definition of producer price index (PPI): a measure of the cost of a basket of goods and services bought by firms. 2. Because firms eventually pass on higher costs to consumers in the form of higher prices on products, the producer price index is believed to be useful in predicting changes in the CPI. D. FYI: What Is in the CPI’s Basket? 1. Figure 1 shows the makeup of the market basket used to compute the CPI. 2. The largest category is housing, which makes up 43% of a typical consumer’s budget. E. Problems in Measuring the Cost of Living 1. Substitution Bias