SUGI 30 Tutorials proc gplot data=sashelp.shoes; where Region in("United States","Eastern Europe"); plot Returns Sales=Region vaxis=axis1 /*vaxis=0 to 15000 by 5000*/ autohref lhref=2 chref=lime autovref lvref=5 cvref-pink caxis=blue ctext=red run; SAS/Graph GPLOT Example Total Returns $5.00 3D.000 600 $100000 s200.000 s300.000 $400000 500000 Taal Sies Reg on ++Eaen Erope+++uited gae Let's do the same thing for the horizontal axis. axis2 proc gplot data=sashelp.shoes; label=(c=darkgreen h=1.5 where Region in("United States","Eastern Europe"); f=zapfbi)】 plot Returns Sales=Region order=(0to500000by50000) vaxis=axisl haxis=axis2 value=(f=swissl autohref lhref=2 chref=lime c=darkgreen); autovref lvref=5 cvref=pink caxis=blue ctext=red run; SAS/Graph GPLOT Example Total Returns 5000 4 6000 0.0$000帕0.0020000250030.0500000050000 Total Sales 6
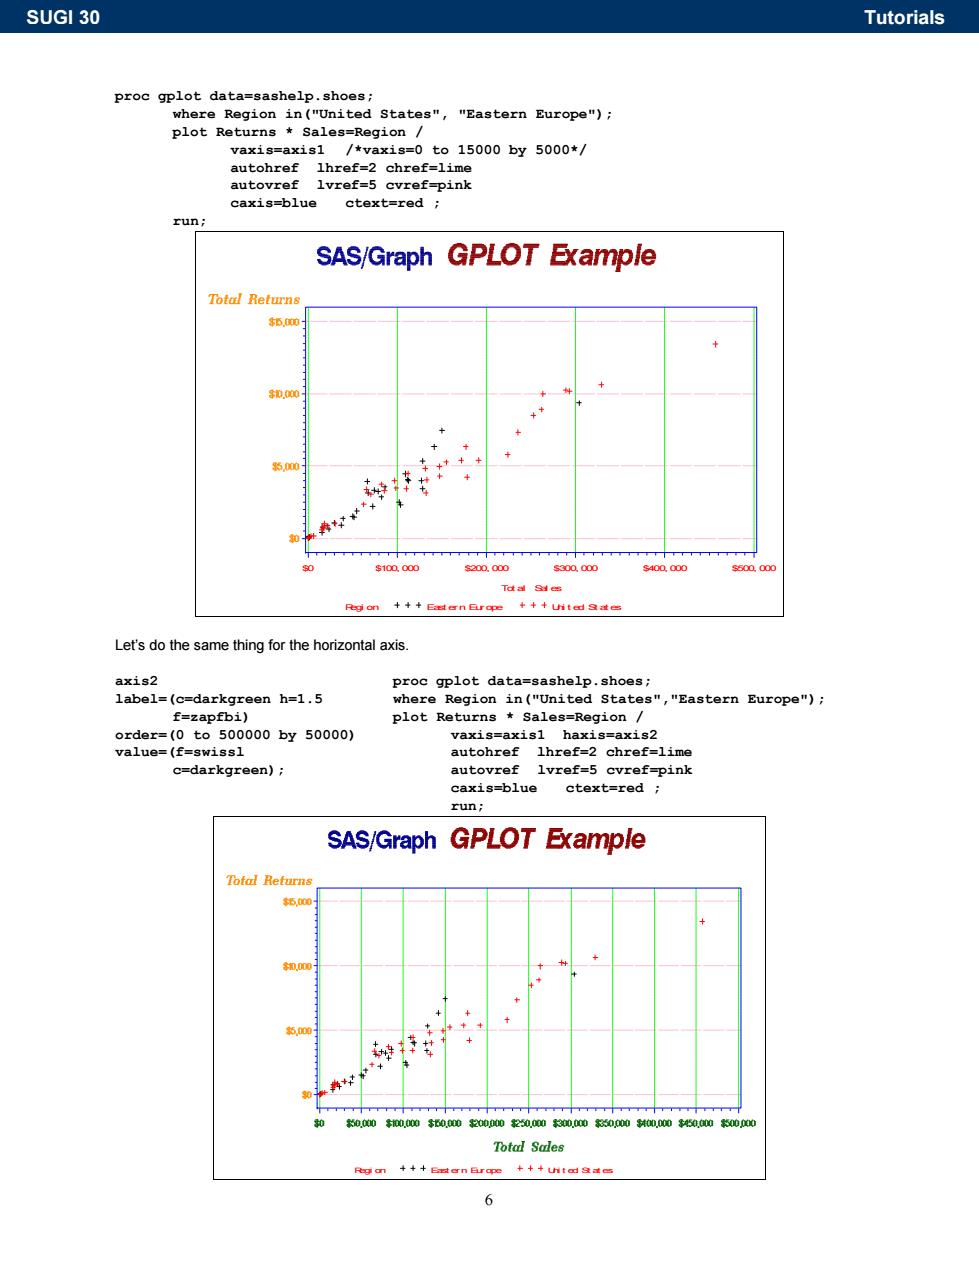
6 proc gplot data=sashelp.shoes; where Region in("United States", "Eastern Europe"); plot Returns * Sales=Region / vaxis=axis1 /*vaxis=0 to 15000 by 5000*/ autohref lhref=2 chref=lime autovref lvref=5 cvref=pink caxis=blue ctext=red ; run; Regi on East ern Europe Uni t ed St at es Tot al Sal es $0 $100, 000 $200, 000 $300, 000 $400, 000 $500, 000 Let’s do the same thing for the horizontal axis. axis2 label=(c=darkgreen h=1.5 f=zapfbi) order=(0 to 500000 by 50000) value=(f=swissl c=darkgreen); proc gplot data=sashelp.shoes; where Region in("United States","Eastern Europe"); plot Returns * Sales=Region / vaxis=axis1 haxis=axis2 autohref lhref=2 chref=lime autovref lvref=5 cvref=pink caxis=blue ctext=red ; run; Regi on East ern Europe Uni t ed St at es SUGI 30 Tutorials

SUGI 30 Tutorials Symbol Now let's see what we can do with those symbols(points)on the plot.By using the SYMBOL statement you can decide how it is going to look and how to join the point.By default,the points are not joined.Let's define two symbol statements for the two regions. symboll c=red h=2 v=#/*heart*/; symbol2 c=blue h=3 v=diamond I am sure you know what the C=and H=define.The VALUE=(V=)is used,instead of say the F=,to define what symbol we want.Again,see the Reference Manual for a complete list of possible option values. If we just rerun the code from earlier,GPLOT will see the new symbol definitions and use them.Simply,if the graph needs 2 symbols it will look for a symbol1 and symbol2 and use them if found.If not,defaults are used. SAS/Graph GPLOT Example Total Returns 86,000 000 , ◇ 00 0衫 Total Sales gam9 Etern Brope◇◇◇uhtadgae Let's add an INTERPOLATION=(I=)option to the symbol statements.See the Reference Manual for a complete list of possible interpolation techniques to decide which best fits your needs(if any).The WIDTH=(W=)option defines the width the line drawn through the points. symboll c=red h=2 v=#/*heart*/i=sm50s w=2; symbol2 c=blue h=3 v=diamond i=splines w=2.5; SAS/Graph GPLOT Example Total Returns 0钟种00和0200002和.03单05000钟老中钟0 Total Sales
7 Symbol Now let’s see what we can do with those symbols (points) on the plot. By using the SYMBOL statement you can decide how it is going to look and how to join the point. By default, the points are not joined. Let’s define two symbol statements for the two regions. symbol1 c=red h=2 v=# /*heart*/; symbol2 c=blue h=3 v=diamond ; I am sure you know what the C= and H= define. The VALUE=(V=) is used, instead of say the F=, to define what symbol we want. Again, see the Reference Manual for a complete list of possible option values. If we just rerun the code from earlier, GPLOT will see the new symbol definitions and use them. Simply, if the graph needs 2 symbols it will look for a symbol1 and symbol2 and use them if found. If not, defaults are used. Regi on East ern Europe Uni t ed St at es Let’s add an INTERPOLATION=(I=) option to the symbol statements. See the Reference Manual for a complete list of possible interpolation techniques to decide which best fits your needs (if any). The WIDTH=(W=) option defines the width the line drawn through the points. symbol1 c=red h=2 v=# /*heart*/ i=sm50s w=2; symbol2 c=blue h=3 v=diamond i=splines w=2.5; Regi on East ern Europe Uni t ed St at es SUGI 30 Tutorials