
IR-Active and Inactive A polar bond is usually IR-active. A nonpolar bond in a symmetrical molecule will absorb weakly or not at all. H represented as ④y0000⊙ force on+ in direction of field force on in direction of field E molecule compressed molecule stretched dipole moment decreased dipole moment increased electric electric field force on- field opposite direction of field force on- opposite direction of field 11 Copyright 2005 Pearson Prentice Hall,Inc
Chapter 12 11 IR-Active and Inactive • A polar bond is usually IR-active. • A nonpolar bond in a symmetrical molecule will absorb weakly or not at all. =>

An Infrared Spectrometer motor reference beam rotating segmented mirror detector reference cell monochromator 000 glowing wire light source transmitted sample cell sample beam chart recorder Copyright2005 Pearson Prentice Hall,Inc. => Chapter 12 12
Chapter 12 12 An Infrared Spectrometer =>
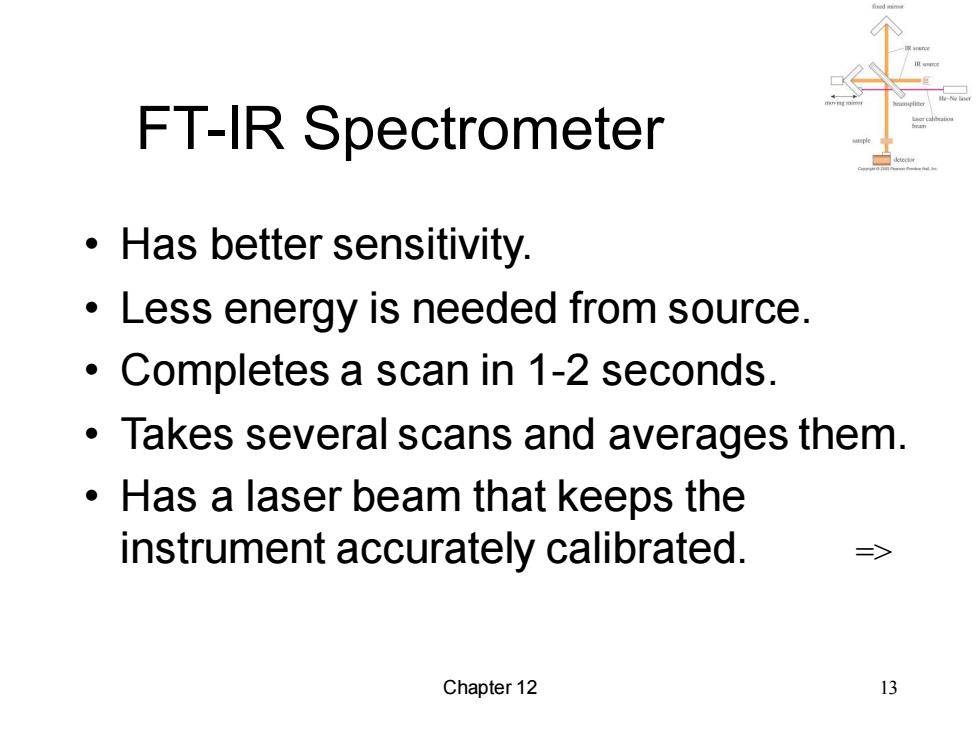
FT-IR Spectrometer Has better sensitivity. Less energy is needed from source. Completes a scan in 1-2 seconds. Takes several scans and averages them. Has a laser beam that keeps the instrument accurately calibrated. => Chapter 12 13
Chapter 12 13 FT-IR Spectrometer • Has better sensitivity. • Less energy is needed from source. • Completes a scan in 1-2 seconds. • Takes several scans and averages them. • Has a laser beam that keeps the instrument accurately calibrated. =>

FT-IR Interferometer fixed mirror IR source IR source He-Ne laser moving mirror beamsplitter laser calibration beam sample => detector 14 Copyright 2005 Pearson Prentice Hall,Inc
Chapter 12 14 FT-IR Interferometer =>
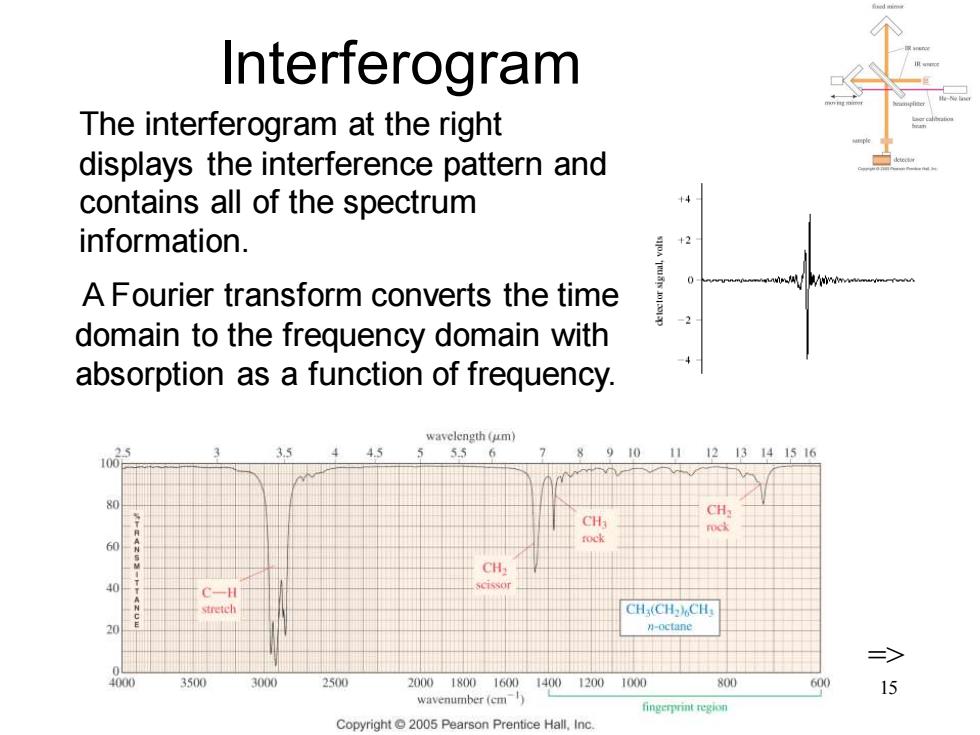
Interferogram The interferogram at the right displays the interference pattern and contains all of the spectrum information. A Fourier transform converts the time domain to the frequency domain with absorption as a function of frequency. wavelength (um) 4.5 55 6 910 111213141516 CH: rock CH -H CHCH-CH 刀-octane 4000 3500 3000 2500 200018001600140012001000 800 60 wavenumber(cm) fingerprint region Copyright 2005 Pearson Prentice Hall,Inc
Chapter 12 15 Interferogram The interferogram at the right displays the interference pattern and contains all of the spectrum information. => A Fourier transform converts the time domain to the frequency domain with absorption as a function of frequency