Clustering Lecture 6:Spectral Methods Jing Gao SUNY Buffalo 1
Clustering Lecture 6: Spectral Methods Jing Gao SUNY Buffalo 1
Outline ·Basics Motivation,definition,evaluation ·Methods -Partitional Hierarchical Density-based -Mixture model -Spectral methods Advanced topics Clustering ensemble Clustering in MapReduce -Semi-supervised clustering,subspace clustering,co-clustering, etc
Outline • Basics – Motivation, definition, evaluation • Methods – Partitional – Hierarchical – Density-based – Mixture model – Spectral methods • Advanced topics – Clustering ensemble – Clustering in MapReduce – Semi-supervised clustering, subspace clustering, co-clustering, etc. 2
Motivation Complex cluster shapes - K-means performs poorly because it can only find spherical clusters Density-based approaches are sensitive to parameters 。Spectral approach Use similarity graphs to encode local neighborhood information Data points are vertices of the graph Connect points which are "close" 1.5 15 3
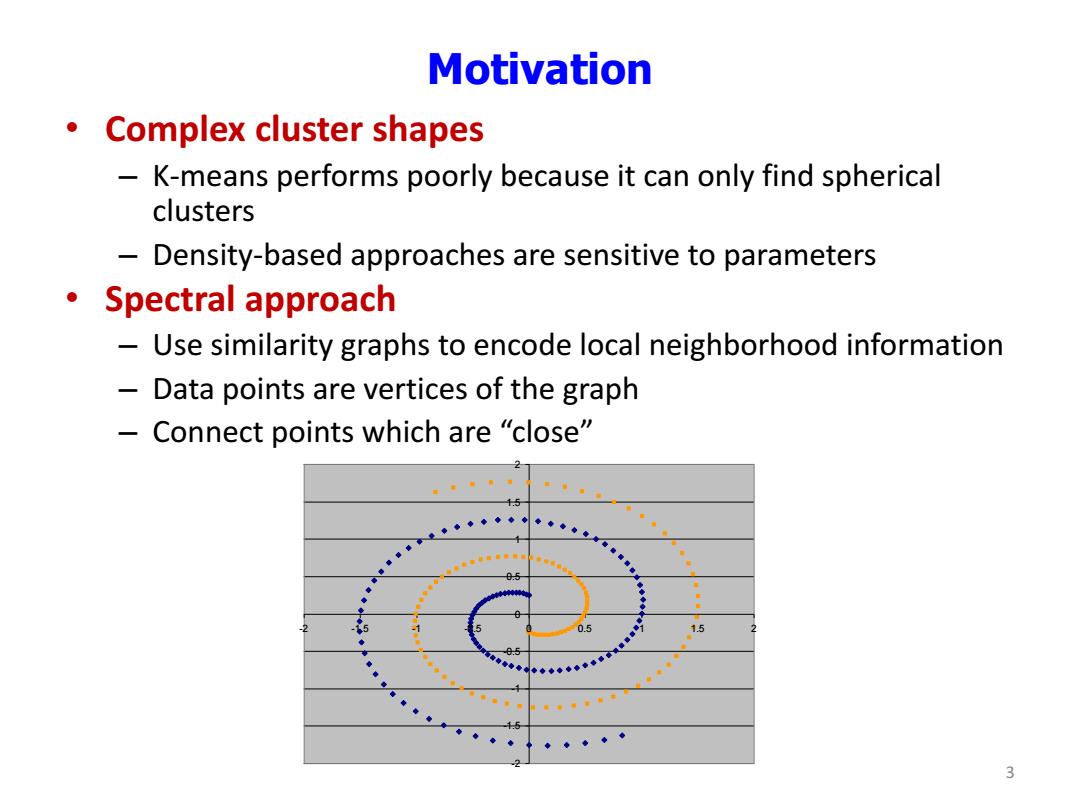
Motivation • Complex cluster shapes – K-means performs poorly because it can only find spherical clusters – Density-based approaches are sensitive to parameters • Spectral approach – Use similarity graphs to encode local neighborhood information – Data points are vertices of the graph – Connect points which are “close” 3 -2 -1.5 -1 -0.5 0 0.5 1 1.5 2 -2 -1.5 -1 -0.5 0 0.5 1 1.5 2

Similarity Graph Represent dataset as a weighted graph G,E) All vertices which can be reached from each other by a path form a connected component Only one connected component in the graph-The graph is fully connected V=x;}Set of n vertices representing data points E={W}Set of weighted edges indicating pair-wise similarity between points 0.1 0.8 0.8 0.8 0.6 6 0.7 0.8 3 0.2 4
0.1 0.2 0.8 0.7 0.6 0.8 0.8 0.8 E={Wij} Set of weighted edges indicating pair-wise similarity between points Similarity Graph • Represent dataset as a weighted graph G(V,E) • All vertices which can be reached from each other by a path form a connected component • Only one connected component in the graph—The graph is fully connected 1 2 6 { , ,..., } v v v 1 2 3 4 5 6 V={xi } Set of n vertices representing data points 4
Graph Construction E-neighborhood graph Identify a threshold value,s,and include edges if the affinity between two points is greater than k-nearest neighbors Insert edges between a node and its k-nearest neighbors Each node will be connected to (at least)k nodes ·Fully connected Insert an edge between every pair of nodes Weight of the edge represents similarity -Gaussian kernel: w,=eXp(-‖x,-x,2/o2) 5
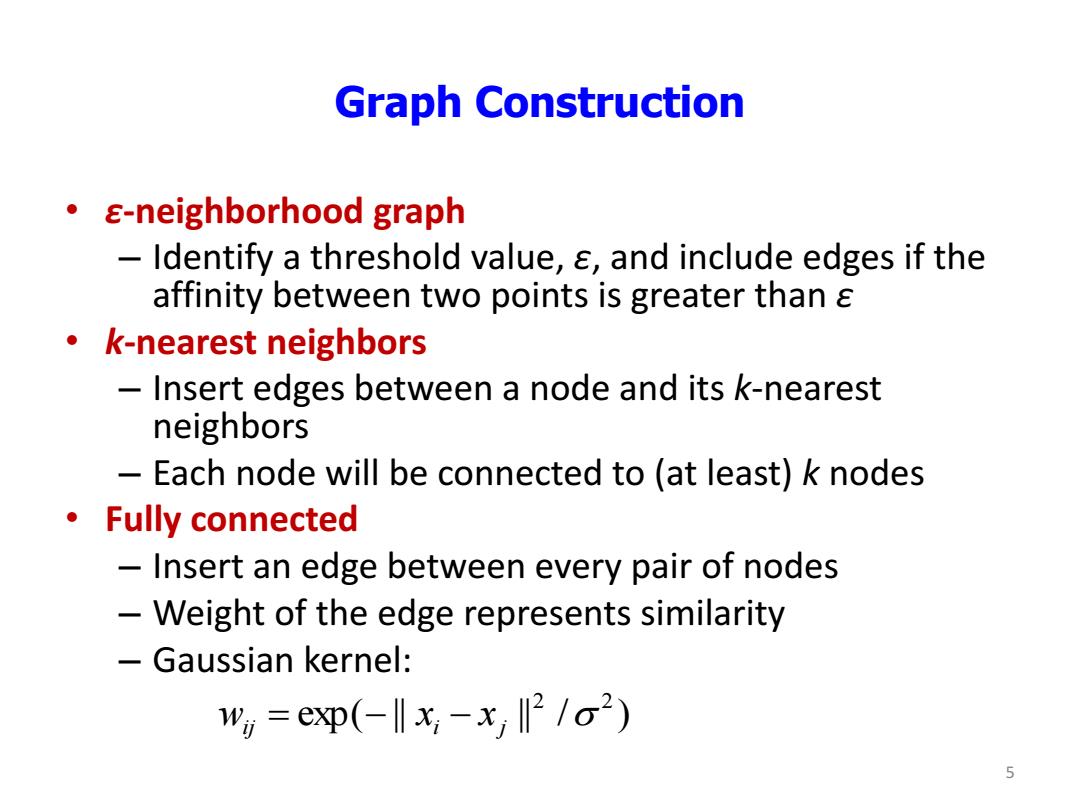
Graph Construction • ε-neighborhood graph – Identify a threshold value, ε, and include edges if the affinity between two points is greater than ε • k-nearest neighbors – Insert edges between a node and its k-nearest neighbors – Each node will be connected to (at least) k nodes • Fully connected – Insert an edge between every pair of nodes – Weight of the edge represents similarity – Gaussian kernel: exp( || || / ) 2 2 wij xi xj 5