
Parameter Estimation and Evaluation Population and Distribution Model Population and Distribution Model In contrast,F is said to be misspecified for fx()if there exists no value for 0ee such that fx(x)=f(x,0)for all xE1.This can occur when,e.g.,we specify a class of normal distribution models but the true population is a Gamma distribution. f红8 f fc.9,) fx@) fx) fc.,) Figure 8.1(a)Correct model specification Figure 8.1(b)Model misspecification Parameter Estimation and Evaluation Introduction to Statistics and Econometrics April 21,2020 6/207
Parameter Estimation and Evaluation Parameter Estimation and Evaluation Introduction to Statistics and Econometrics April 21, 2020 6/207 Population and Distribution Model Population and Distribution Model
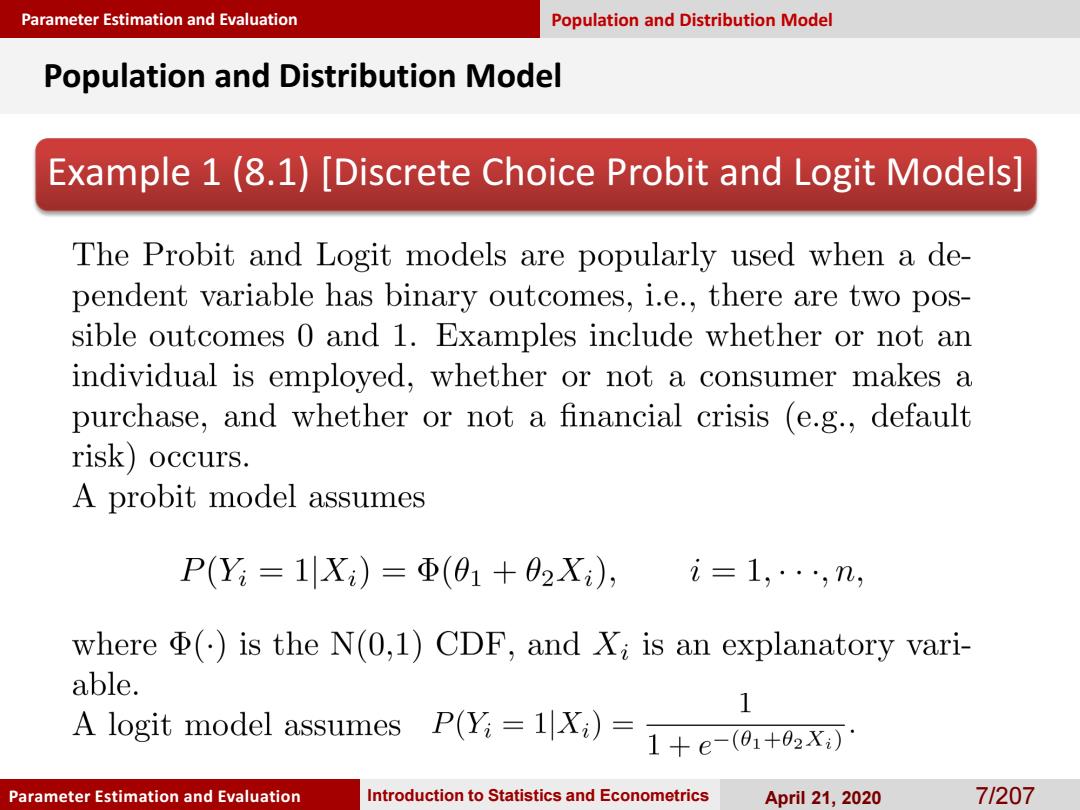
Parameter Estimation and Evaluation Population and Distribution Model Population and Distribution Model Example 1(8.1)[Discrete Choice Probit and Logit Models] The Probit and Logit models are popularly used when a de- pendent variable has binary outcomes,i.e.,there are two pos- sible outcomes 0 and 1.Examples include whether or not an individual is employed,whether or not a consumer makes a purchase,and whether or not a financial crisis (e.g.,default risk)occurs. A probit model assumes P(Y=1X)=Φ(01+02X), i=1,···,m, where (is the N(0,1)CDF,and Xi is an explanatory vari- able. 1 A logit model assumes P(Yi=1Xi)= 1+e-(01+02X) Parameter Estimation and Evaluation Introduction to Statistics and Econometrics April 21,2020 71207
Parameter Estimation and Evaluation Parameter Estimation and Evaluation Introduction to Statistics and Econometrics April 21, 2020 7/207 Population and Distribution Model Population and Distribution Model Example 1 (8.1) [Discrete Choice Probit and Logit Models]

Parameter Estimation and Evaluation Population and Distribution Model Population and Distribution Model Example 1(8.1)[Discrete Choice Probit and Logit Models] On 19 December 2018,$&P500 dropped 1.54%,the next day(20 December 2018),KLCI dropped 0.31%.The linear and logit regression model published on 14 December 2018(Read more here)predicted the KLCI would fall 0.37%and the chances of the drop are as high as 75%.This shows that the quantitative approach is indeed decent. Logit vs Profit Model(S&P500 Impact on KLCI) 09 Logit Probit 1 1 22 Probability=1+eo+) Probability e 2 dz 0.6 2πJ-0 0.5 0.2 0.2 15.0% 10.0% 50% 0.0% 50% 100w 15.w ◆一Logt一◆一升abt Chart shows the probability plot for both logit and probit models.Both models should give similar results. The slight difference is logit model has fatter tail. Parameter Estimation and Evaluation Introduction to Statistics and Econometrics April 21,2020 8/207
Parameter Estimation and Evaluation Parameter Estimation and Evaluation Introduction to Statistics and Econometrics April 21, 2020 8/207 Population and Distribution Model Population and Distribution Model Example 1 (8.1) [Discrete Choice Probit and Logit Models] On 19 December 2018, S&P500 dropped 1.54%, the next day (20 December 2018), KLCI dropped 0.31%. The linear and logit regression model published on 14 December 2018 (Read more here) predicted the KLCI would fall 0.37% and the chances of the drop are as high as 75%. This shows that the quantitative approach is indeed decent. Chart shows the probability plot for both logit and probit models. Both models should give similar results. The slight difference is logit model has fatter tail
Parameter Estimation and Evaluation Population and Distribution Model Population and Distribution Model Example 2(8.2)[Survival/Duration Analysis] Suppose we are interested in the time length it takes for an unemployed person to find a job,the time length that elapses between two trades or two price changes,the length of a strike, the length before a cancer patient dies,and the length before a financial crisis (e.g.,credit default risk)comes out.Such analysis is called duration analysis or survival analysis. In practice,the main interest often lies in the question of how long a duration will continue,given that it has not finished yet.The hazard rate measures the chance that the duration will end now,given that it has not ended before.This hazard rate can be interpreted as the chance to find a job,to trade, to end a strike,etc. Parameter Estimation and Evaluation Introduction to Statistics and Econometrics April 21,2020 91207
Parameter Estimation and Evaluation Parameter Estimation and Evaluation Introduction to Statistics and Econometrics April 21, 2020 9/207 Population and Distribution Model Population and Distribution Model Example 2 (8.2) [Survival/Duration Analysis]
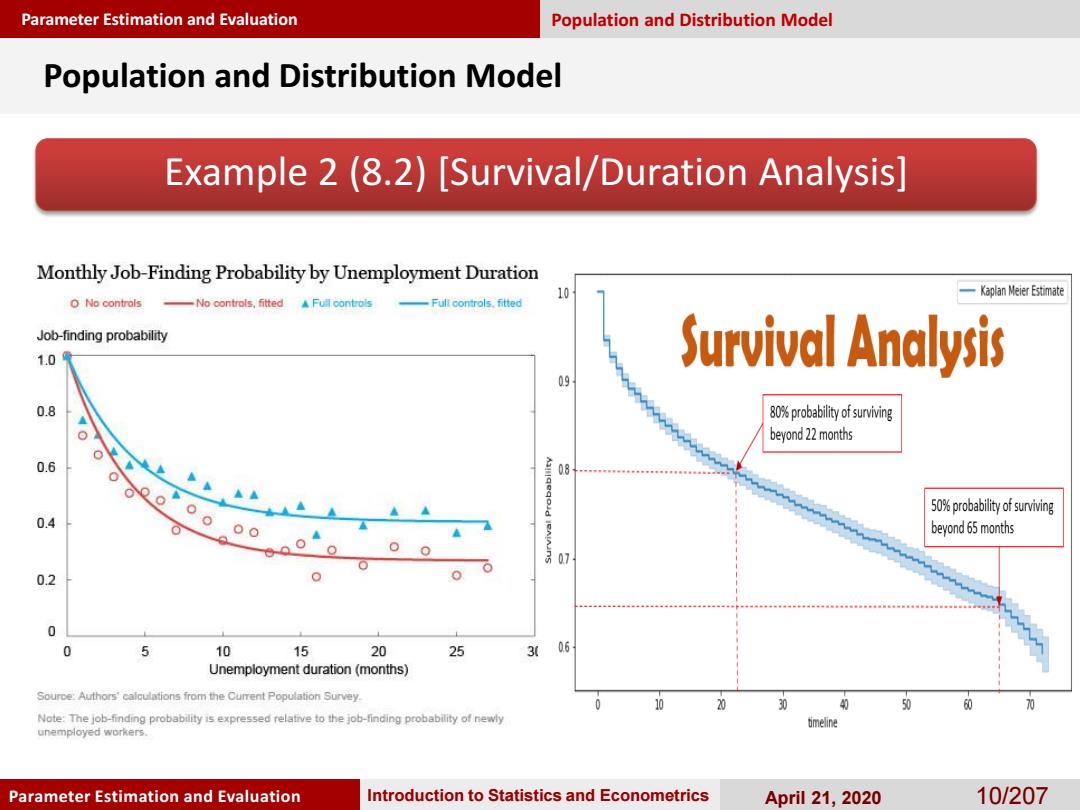
Parameter Estimation and Evaluation Population and Distribution Model Population and Distribution Model Example 2(8.2)[Survival/Duration Analysis] Monthly Job-Finding Probability by Unemployment Duration 10 -Kaplan Meier Estimate O No controls -No controls,fitted Full controls 一Full controls.fted Job-finding probability 1.0 Survival Analysis 09 0.8 8%probability of surviving beyond 22 months 0.6 0 50%probability of surviving 0.4 . beyond 65 months 02 0 0 5 10 15 20 25 3 06 Unemployment duration(months) Source:Authors'calqulations from the Cumrent Population Survey. 30 40 50 60 Note:The job-finding probability is expressed relative to the job-finding probability of newly timeline unemployed workers. Parameter Estimation and Evaluation Introduction to Statistics and Econometrics April 21,2020 10/207
Parameter Estimation and Evaluation Parameter Estimation and Evaluation Introduction to Statistics and Econometrics April 21, 2020 10/207 Population and Distribution Model Population and Distribution Model Example 2 (8.2) [Survival/Duration Analysis]