Brief Contents PARt ONE Introduction and Review Chapter 1 Economic Questions and Data 43 Chapter 2 Review of Probability 55 Chapter 3 Review of Statistics 103 PART TWO Fundamentals of Regression Analysis Chapter4 Linear Regression with One Regressor 143 Chapter 5 Regression with a Single Regressor:Hypothesis Tests and Confidence Intervals 178 Chapter6 Linear Regression with Multiple Regressors 211 Chapter 7 Hypothesis Tests and Confidence Intervals in Multiple Regression 247 Chapter8 Nonlinear Regression Functions 277 Chapter 9 Assessing Studies Based on Multiple Regression 330 PART THREE Further Topics in Regression Analysis Chapter 10 Regression with Panel Data 361 Chapter 11 Regression with a Binary Dependent Variable 392 Chapter12 Instrumental Variables Regression 427 Chapter 13 Experiments and Quasi-Experiments 474 Chapter14 Prediction with Many Regressors and Big Data 514 PART FOUR Regression Analysis of Economic Time Series Data Chapter 15 Introduction to Time Series Regression and Forecasting 554 Chapter 16 Estimation of Dynamic Causal Effects 609 Chapter 17 Additional Topics in Time Series Regression 649 PART FIVE Regression Analysis of Economic Time Series Data Chapter 18 The Theory of Linear Regression with One Regressor 687 The Theory of Multiple Regression 713 5
5 Brief Contents PART ONE Introduction and Review Chapter 1 Economic Questions and Data 43 Chapter 2 Review of Probability 55 Chapter 3 Review of Statistics 103 PART TWO Fundamentals of Regression Analysis Chapter 4 Linear Regression with One Regressor 143 Chapter 5 Regression with a Single Regressor: Hypothesis Tests and Confidence Intervals 178 Chapter 6 Linear Regression with Multiple Regressors 211 Chapter 7 Hypothesis Tests and Confidence Intervals in Multiple Regression 247 Chapter 8 Nonlinear Regression Functions 277 Chapter 9 Assessing Studies Based on Multiple Regression 330 PART THREE Further Topics in Regression Analysis Chapter 10 Regression with Panel Data 361 Chapter 11 Regression with a Binary Dependent Variable 392 Chapter 12 Instrumental Variables Regression 427 Chapter 13 Experiments and Quasi-Experiments 474 Chapter 14 Prediction with Many Regressors and Big Data 514 PART FOUR Regression Analysis of Economic Time Series Data Chapter 15 Introduction to Time Series Regression and Forecasting 554 Chapter 16 Estimation of Dynamic Causal Effects 609 Chapter 17 Additional Topics in Time Series Regression 649 PART FIVE Regression Analysis of Economic Time Series Data Chapter 18 The Theory of Linear Regression with One Regressor 687 Chapter 19 The Theory of Multiple Regression 713 A01_STOC4455_04_GE_FM.indd 5 06/12/18 10:51 AM

This page intentionally left blank
A01_MISH4182_11_GE_FM.indd 6 10/06/15 11:46 am This page intentionally left blank

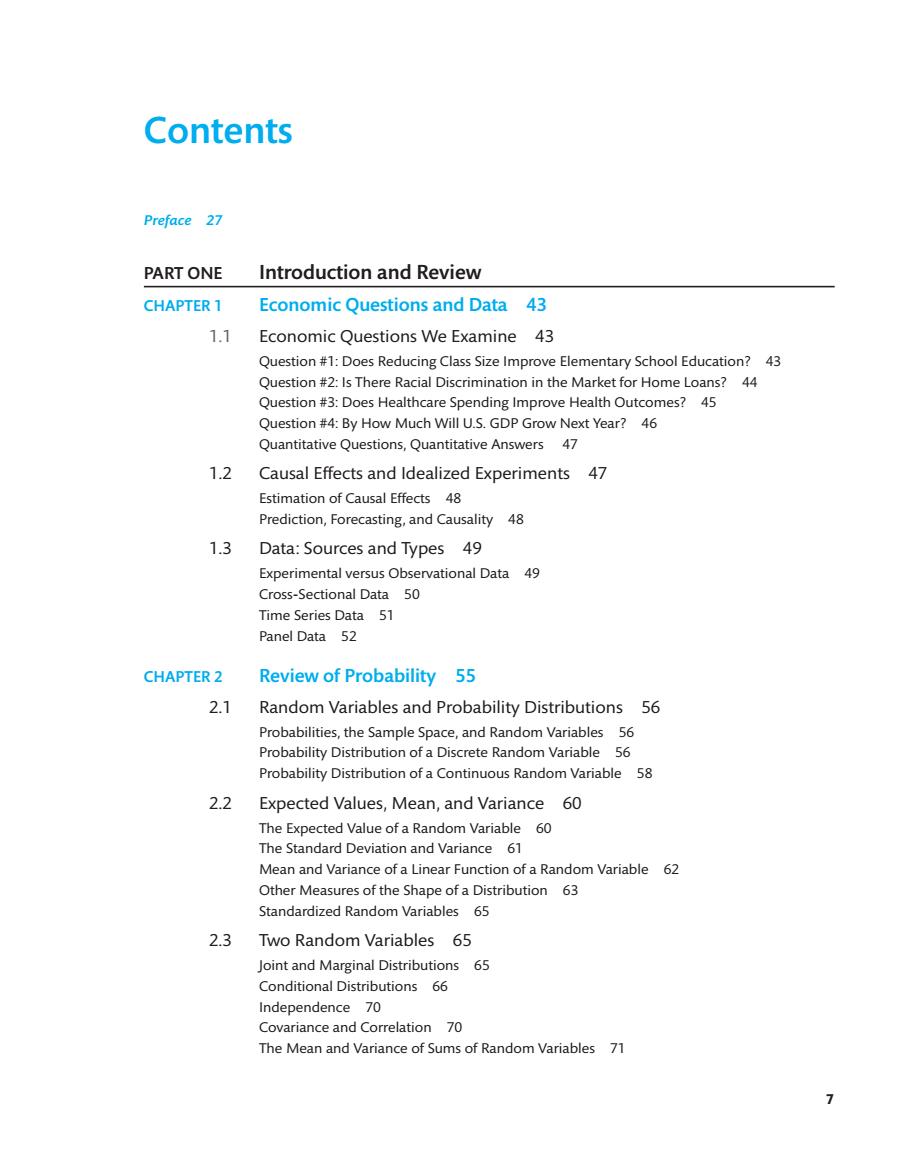
Contents Preface 27 PART ONE Introduction and Review CHAPTER 1 Economic Questions and Data 43 1.1 Economic Questions We Examine 43 Question #1:Does Reducing Class Size Improve Elementary School Education?43 Racial Discrimination in the Market for HomeLoans?44 e Health Outcomes?45 Question#4:By How Much Will U.S.GDP Grow Next Year? 46 Quantitative Questions,Quantitative Answers 47 1.2 Causal Effects and Idealized Experiments 47 Estimation of Causal Effects 48 Prediction,Forecasting,and Causality 48 1.3 Data:Sources and Types 49 Experimental versus Observational Data 49 Cross-Sectional Data 50 Time Series Data 51 Panel Data 52 CHAPTER 2 Review of Probability 55 2.1 Random Variables and Probability Distributions 56 Probabilities,the Sample Space,and Random Variables 56 Probability Distribution of a Discrete Random Variable 56 Probability Distribution of a Continuous Random Variable 58 2.2 Expected Values,Mean,and Variance 60 The Expected Value of a Random Variable 60 The Standard Deviation and Variance 61 Mean and Variance of a Linear Function of a Random Variable 62 Other Measures of the Shape of a Distribution 63 Standardized Random Variables 65 2.3 Two Random Variables 65 Joint and Marginal Distributions 65 Conditional Distributions 66 Independence 70 Covariance and Correlation 70 The Mean and Variance of Sums of Random Variables 71 7
7 Contents Preface 27 PART ONE Introduction and Review CHAPTER 1 Economic Questions and Data 43 1.1 Economic Questions We Examine 43 Question #1: Does Reducing Class Size Improve Elementary School Education? 43 Question #2: Is There Racial Discrimination in the Market for Home Loans? 44 Question #3: Does Healthcare Spending Improve Health Outcomes? 45 Question #4: By How Much Will U.S. GDP Grow Next Year? 46 Quantitative Questions, Quantitative Answers 47 1.2 Causal Effects and Idealized Experiments 47 Estimation of Causal Effects 48 Prediction, Forecasting, and Causality 48 1.3 Data: Sources and Types 49 Experimental versus Observational Data 49 Cross-Sectional Data 50 Time Series Data 51 Panel Data 52 CHAPTER 2 Review of Probability 55 2.1 Random Variables and Probability Distributions 56 Probabilities, the Sample Space, and Random Variables 56 Probability Distribution of a Discrete Random Variable 56 Probability Distribution of a Continuous Random Variable 58 2.2 Expected Values, Mean, and Variance 60 The Expected Value of a Random Variable 60 The Standard Deviation and Variance 61 Mean and Variance of a Linear Function of a Random Variable 62 Other Measures of the Shape of a Distribution 63 Standardized Random Variables 65 2.3 Two Random Variables 65 Joint and Marginal Distributions 65 Conditional Distributions 66 Independence 70 Covariance and Correlation 70 The Mean and Variance of Sums of Random Variables 71 A01_STOC4455_04_GE_FM.indd 7 20/12/18 4:23 PM

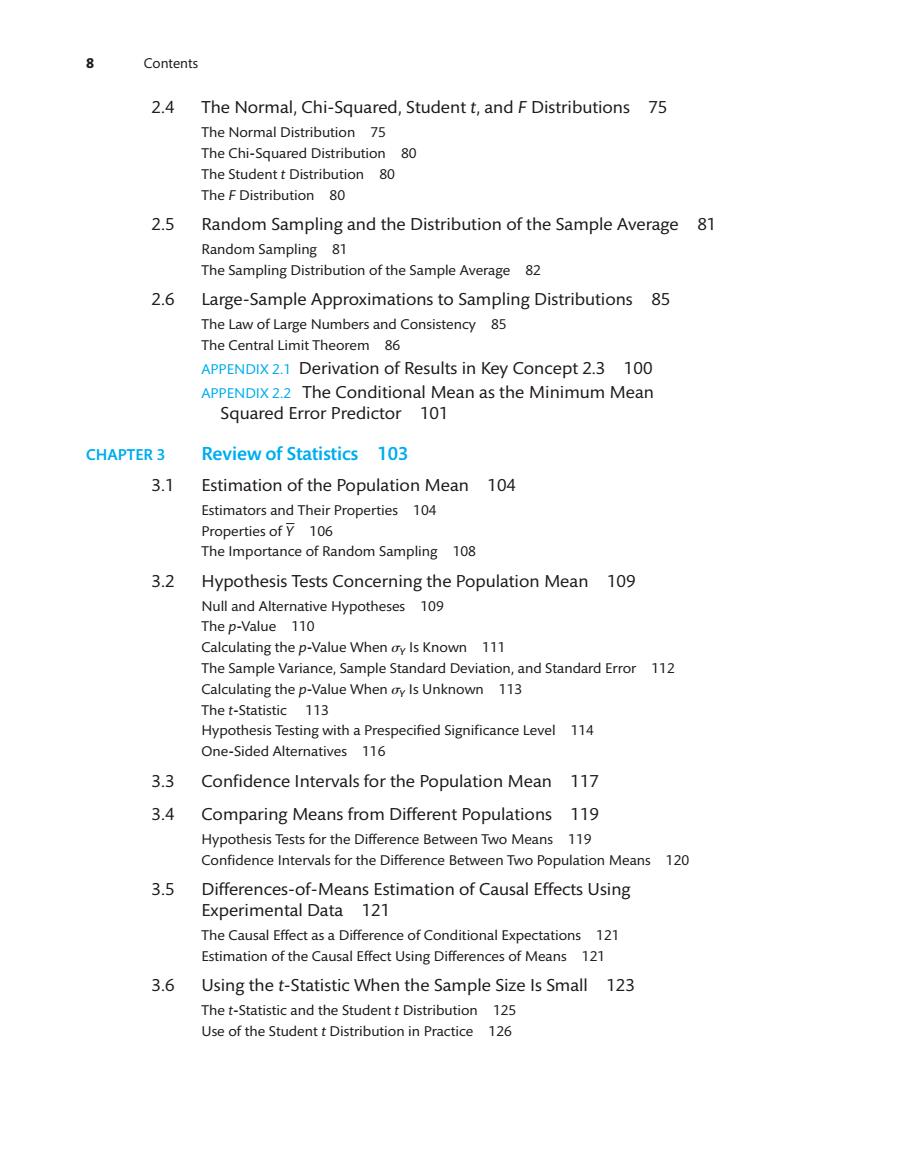
Contents 2.4 The Normal,Chi-Squared,Student t,and F Distributions 75 80 The Studentt Distribution 80 The F Distribution 80 2.5 Random Sampling and the Distribution of the Sample Average 81 2.6 Large-Sample Approximations to Sampling Distributions 85 The Law of Large Numbers and Consistency 85 The Central Limit Theorem 86 APPENDIX 2.1 Derivation of Results in Key Concept 2.3 100 APPENDIX 2.2 The Conditional Mean as the Minimum Mean Squared Error Predictor 101 CHAPTER 3 Review of Statistics 103 3.1 Estimation of the Population Mean 104 Estimators and Their Properties 104 Properties of y 106 The Importance of Random Sampling 108 32 Hypothesis Tests Concerning the Population Mean 109 Null and Alternative Hypotheses 109 The p-Value 110 Calculating the p-Value When ay Is Known 111 The Sample Variance,Sample Standard Deviation,and Standard Error 112 Calculating the p-Value When ay Is Unknown 113 The t-Sta 773 Testing with a Prespecified Significance Level 114 One-Sided Altemnatives 116 3.3 Confidence Intervals for the Population Mean 117 3.4 Comparing Means from Different Populations 119 Hypothesis Tests for the Difference Between Two Means 119 Confidence Intervals for the Difference Between Two Population Means 120 3.5 Differences-of-Means Estimation of Causal Effects Using Experimental Data 121 The Causal Effect as a Differ ence of Conditional Expectations 121 Estimation of the Causal Effect Using Differences of Means 121 3.6 Using the t-Statistic When the Sample Size Is Small 123 The t-Statistic and the Student t Distribution 125 Use of the Student t Distribution in Practice 126
8 Contents 2.4 The Normal, Chi-Squared, Student t, and F Distributions 75 The Normal Distribution 75 The Chi-Squared Distribution 80 The Student t Distribution 80 The F Distribution 80 2.5 Random Sampling and the Distribution of the Sample Average 81 Random Sampling 81 The Sampling Distribution of the Sample Average 82 2.6 Large-Sample Approximations to Sampling Distributions 85 The Law of Large Numbers and Consistency 85 The Central Limit Theorem 86 APPENDIX 2.1 Derivation of Results in Key Concept 2.3 100 APPENDIX 2.2 The Conditional Mean as the Minimum Mean Squared Error Predictor 101 CHAPTER 3 Review of Statistics 103 3.1 Estimation of the Population Mean 104 Estimators and Their Properties 104 Properties of Y 106 The Importance of Random Sampling 108 3.2 Hypothesis Tests Concerning the Population Mean 109 Null and Alternative Hypotheses 109 The p-Value 110 Calculating the p-Value When sY Is Known 111 The Sample Variance, Sample Standard Deviation, and Standard Error 112 Calculating the p-Value When sY Is Unknown 113 The t-Statistic 113 Hypothesis Testing with a Prespecified Significance Level 114 One-Sided Alternatives 116 3.3 Confidence Intervals for the Population Mean 117 3.4 Comparing Means from Different Populations 119 Hypothesis Tests for the Difference Between Two Means 119 Confidence Intervals for the Difference Between Two Population Means 120 3.5 Differences-of-Means Estimation of Causal Effects Using Experimental Data 121 The Causal Effect as a Difference of Conditional Expectations 121 Estimation of the Causal Effect Using Differences of Means 121 3.6 Using the t-Statistic When the Sample Size Is Small 123 The t-Statistic and the Student t Distribution 125 Use of the Student t Distribution in Practice 126 A01_STOC4455_04_GE_FM.indd 8 20/12/18 4:24 PM

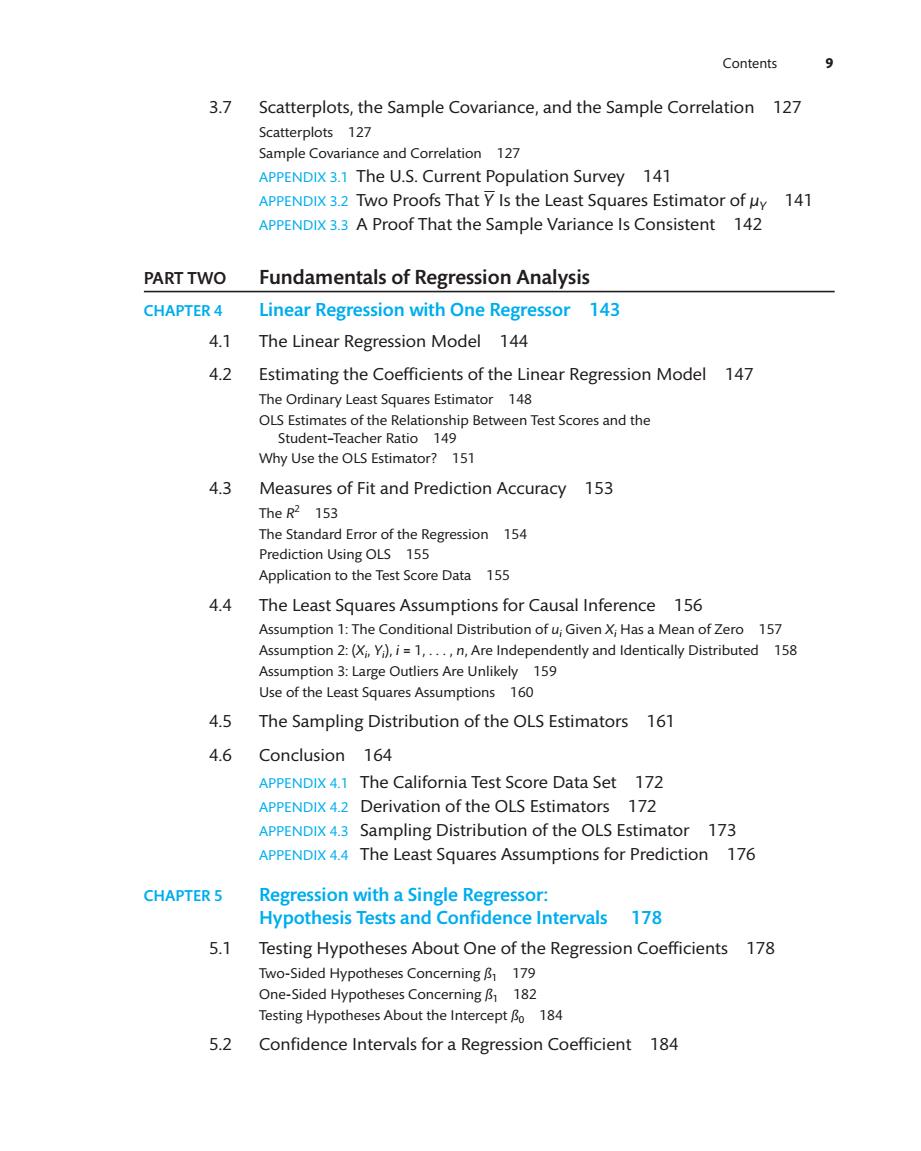
Contents 9 3.7 Scatterplots,the Sample Covariance,and the Sample Correlation 127 Scatterplots 127 Sample Covariance and Correlation 127 APPENDIX 3.1 The U.S.Current Population Survey 141 APPENDIX 3.2 Two Proofs That Y Is the Least Squares Estimator of uy 141 APPENDIX 3.3 A Proof That the Sample Variance Is Consistent 142 PART TWO Fundamentals of Regression Analysis CHAPTER 4 Linear Regression with One Regressor 143 4.1 The Linear Regression Model 144 4.2 Estimating the Coefficients of the Linear Regression Model 147 The Ordinary Least Squares Estimator 148 OLs Estimates of the relationship between test scores and the Student-Teacher Ratio 149 Why Use the OLS Estimator?151 4.3 Measures of Fit and Prediction Accuracy 153 The R2 153 The Standard Error of the Regression 154 Prediction Using OLS 155 Application to the Test Score Data 155 4.4 The Least Squares Assumptions for Causal Inference 156 Assumption 1:The Conditional Distribution ofu,GivenX,Has a Mean of Zero 157 Assumption2:(XY).i=1.n.Are Independently and Identically Distributed 158 Assumption 3:Large Outliers Are Unlikely 159 Use of the Least Squares Assumptions 160 4.5 The Sampling Distribution of the OLS Estimators 161 4.6 Conclusion 164 APPENDIX 4.1 The California Test Score Data Set 172 APPENDIX 4.2 Derivation of the OLS Estimators 172 APPENDIX 4.3 Sampling Distribution of the OLS Estimator 173 APPENDIX 4.4 The Least Squares Assumptions for Prediction 176 CHAPTER5 Regression with a Single Regressor: Hypothesis Tests and Confidence Intervals 178 5) Testing Hypotheses About One of the Regression Coefficients 178 Two-Sided Hypotheses Concerning B179 One-Sided Hypotheses Concerning B 182 Testing Hypotheses About the Intercept Bo 184 5.2 Confidence Intervals for a Regression Coefficient 184
Contents 9 3.7 Scatterplots, the Sample Covariance, and the Sample Correlation 127 Scatterplots 127 Sample Covariance and Correlation 127 APPENDIX 3.1 The U.S. Current Population Survey 141 APPENDIX 3.2 Two Proofs That Y Is the Least Squares Estimator of μY 141 APPENDIX 3.3 A Proof That the Sample Variance Is Consistent 142 PART TWO Fundamentals of Regression Analysis CHAPTER 4 Linear Regression with One Regressor 143 4.1 The Linear Regression Model 144 4.2 Estimating the Coefficients of the Linear Regression Model 147 The Ordinary Least Squares Estimator 148 OLS Estimates of the Relationship Between Test Scores and the Student–Teacher Ratio 149 Why Use the OLS Estimator? 151 4.3 Measures of Fit and Prediction Accuracy 153 The R2 153 The Standard Error of the Regression 154 Prediction Using OLS 155 Application to the Test Score Data 155 4.4 The Least Squares Assumptions for Causal Inference 156 Assumption 1: The Conditional Distribution of ui Given Xi Has a Mean of Zero 157 Assumption 2: (Xi , Yi ), i = 1, . . . , n, Are Independently and Identically Distributed 158 Assumption 3: Large Outliers Are Unlikely 159 Use of the Least Squares Assumptions 160 4.5 The Sampling Distribution of the OLS Estimators 161 4.6 Conclusion 164 APPENDIX 4.1 The California Test Score Data Set 172 APPENDIX 4.2 Derivation of the OLS Estimators 172 APPENDIX 4.3 Sampling Distribution of the OLS Estimator 173 APPENDIX 4.4 The Least Squares Assumptions for Prediction 176 CHAPTER 5 Regression with a Single Regressor: Hypothesis Tests and Confidence Intervals 178 5.1 Testing Hypotheses About One of the Regression Coefficients 178 Two-Sided Hypotheses Concerning ß1 179 One-Sided Hypotheses Concerning ß1 182 Testing Hypotheses About the Intercept ß0 184 5.2 Confidence Intervals for a Regression Coefficient 184 A01_STOC4455_04_GE_FM.indd 9 06/12/18 10:52 AM