Plotting (1/43) >The‘plot'command √ plot(X,Y) 。 Plots vector Y versus vector X. X=5:5, Y=X.2; plot(X,Y); 25 35 If X and Y are matrixes,each column of the matrix will be plotted. x=[123,234;345] y=[135,246,357刀 345 23 345 56 7 @月济大学 TONGJI UNIVERSITY plot(x,y)
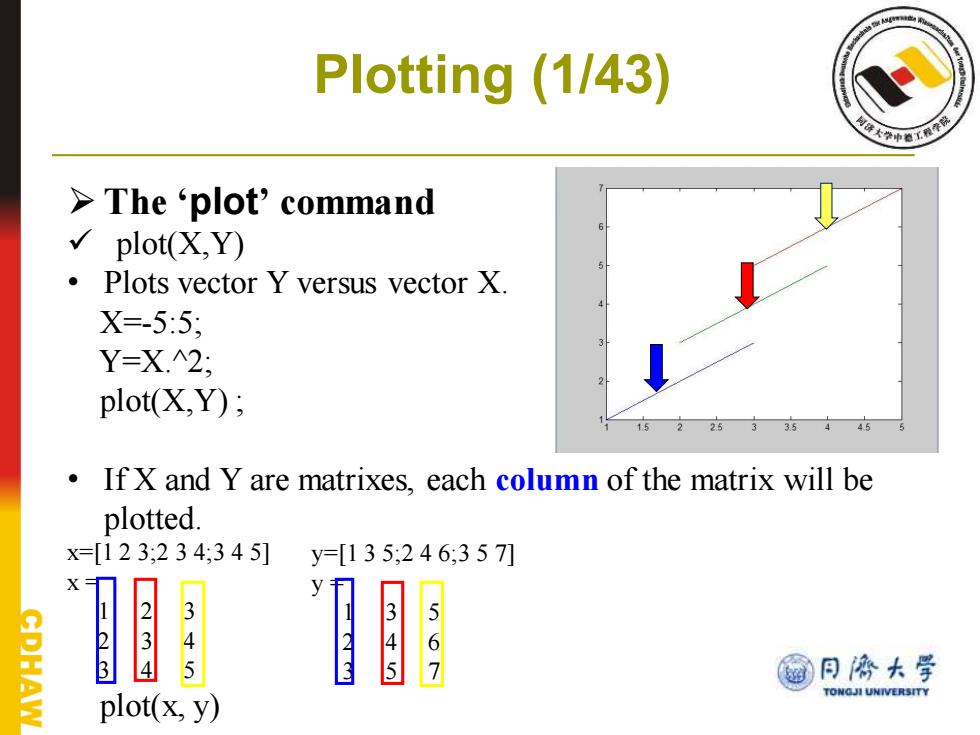
Plotting (1/43) ➢ The ‘plot’ command ✓ plot(X,Y) • Plots vector Y versus vector X. X=-5:5; Y=X.^2; plot(X,Y) ; • If X and Y are matrixes, each column of the matrix will be plotted. x=[1 2 3;2 3 4;3 4 5] x = 1 2 3 2 3 4 3 4 5 plot(x, y) y=[1 3 5;2 4 6;3 5 7] y = 1 3 5 2 4 6 3 5 7
Plotting (2/43) plot(Y) Plots the columns of Y versus their index (Y is a real number) Y=1:10; plot(Y); If Y is complex,plot(Y)is equivalent to plot(real(Y),imag(Y)). Y=[1+i,2+2i,3-2i,4+3i]: plot(Y); @月协大学 TONGJI UNIVERSITY
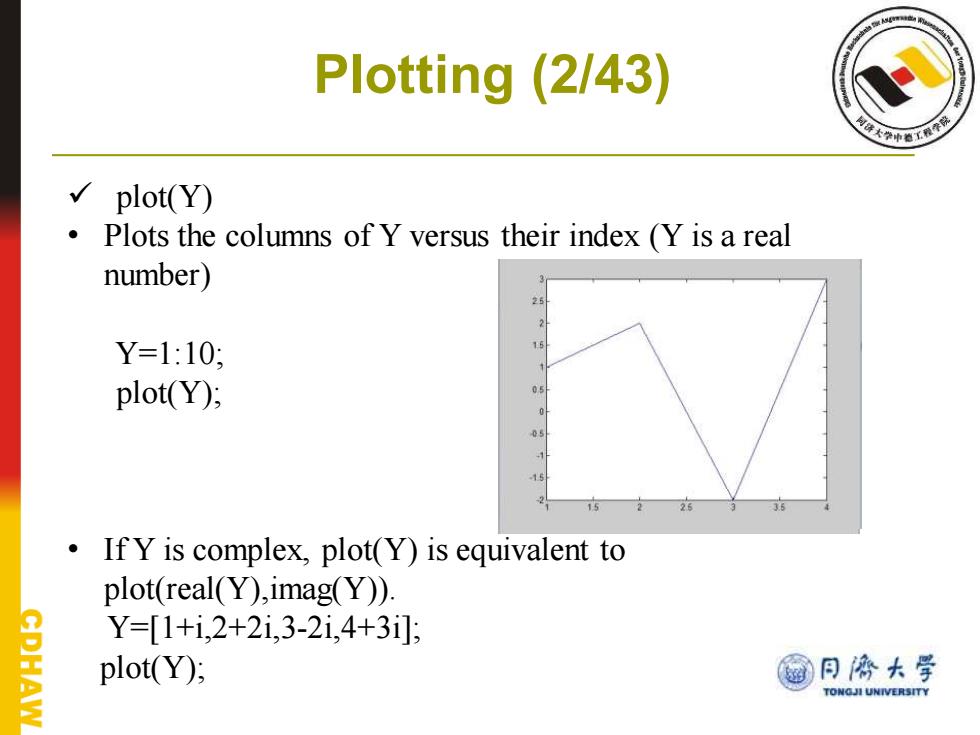
Plotting (2/43) ✓ plot(Y) • Plots the columns of Y versus their index (Y is a real number) Y=1:10; plot(Y); • If Y is complex, plot(Y) is equivalent to plot(real(Y),imag(Y)). Y=[1+i,2+2i,3-2i,4+3i]; plot(Y);
Plotting (3/43) If Y is matrix,plot(Y)is equivalent to plot each column of the matrix Y=[135;246,357] Y- 567 plot(Y) 12 1.4 1618222242628 翻日济大学 TONGJI UNIVERSITY
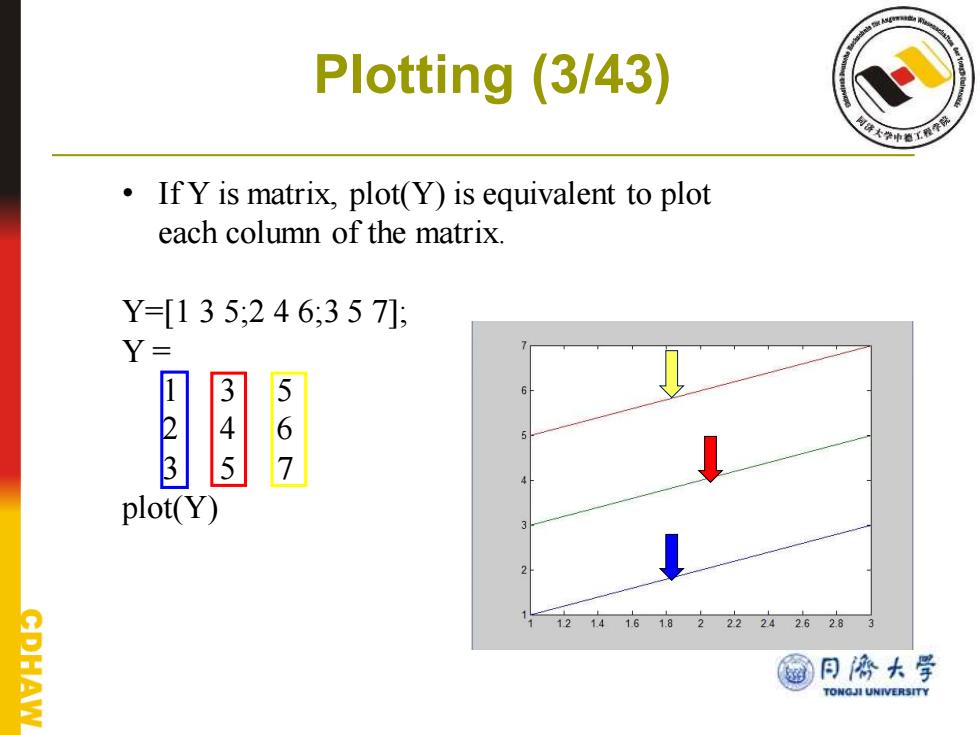
Plotting (3/43) • If Y is matrix, plot(Y) is equivalent to plot each column of the matrix. Y=[1 3 5;2 4 6;3 5 7]; Y = 1 3 5 2 4 6 3 5 7 plot(Y)
Plotting (4/43) >How to plot a figure like this? title(name of the figure') sin(x)cos(x) legend(namel','name2') 0.9 sin(x) 0.8 cos(x) 0.7 0.6 point of intersection 0.5 4 ylabel(name text(xy,note?) 02 CPHAW 0 0.2 0.4 0.6 0.8 12 1.6 @月停大学 TONGJI UNIVERSITY xlabel(name)
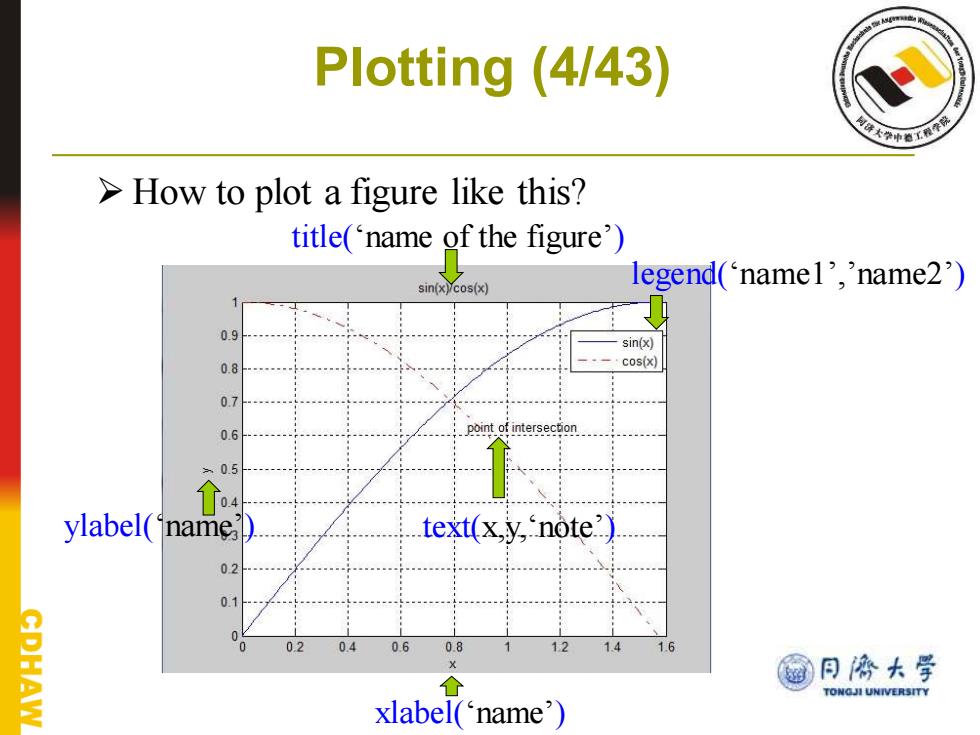
Plotting (4/43) ➢ How to plot a figure like this? title(‘name of the figure’) legend(‘name1’,’name2’) xlabel(‘name’) ylabel(‘name’) text(x,y,‘note’)
Plotting (5/43) linspace(x1,x2)generates a row vector of 100 linearly equally spaced points between x1 and x2 linspace(x1,x2,N)generates N points between x1 and x2 x linspace(10,20,5) X= 10.0012.5015.0017.5020.00 logspace(x1,x2)can be used for logarithmically equally spaced points PHAW 同濟大学 TONGJI UNIVERSITY
Plotting (5/43) ➢ linspace(x1,x2) generates a row vector of 100 linearly equally spaced points between x1 and x2 ➢ linspace(x1,x2,N) generates N points between x1 and x2 x = linspace(10,20,5) x = 10.00 12.50 15.00 17.50 20.00 ➢ logspace(x1,x2) can be used for logarithmically equally spaced points