Probability and Statistics(1/35) Concept Probability is a measure of the likelihood that some event will occur.It is also a way to quantify or to gauge the likelihood that an observed measurement or random variable will take on values within some set or range of values. A random experiment is defined as a process or action whose outcome cannot be predicted with certainty and would likely change when the experiment is repeated. >The sample space is the set of all outcomes from an experiment. It is possible sometimes to list all outcomes in the sample space. @月两大学 AW TONGJI UNIVERSITY
➢ Probability is a measure of the likelihood that some event will occur. It is also a way to quantify or to gauge the likelihood that an observed measurement or random variable will take on values within some set or range of values. ➢ A random experiment is defined as a process or action whose outcome cannot be predicted with certainty and would likely change when the experiment is repeated. ➢ The sample space is the set of all outcomes from an experiment. It is possible sometimes to list all outcomes in the sample space. Probability and Statistics(1/35) Concept
Probability and Statistics(2/35) Concept To find the probability that a continuous random variable falls in a particular interval of real numbers,we have to calculate the appropriate area under the curve of f). This is represented by: b P(a≤X≤b)=∫fx)dr CDHAW @月停大学 TONGJI UNIVERSITY
➢ To find the probability that a continuous random variable falls in a particular interval of real numbers, we have to calculate the appropriate area under the curve of f(x). This is represented by: Probability and Statistics(2/35) Concept
Probability and Statistics(3/35) Concept The cumulative distribution function F(x)is defined as the probability that the random variable X assumes a value less than or equal to a given x. This is calculated from the probability density function,as follows: F(x)=P(X≤x)=∫ft)d. @日济大学 TONGJI UNIVERSITY
➢ The cumulative distribution function F(x) is defined as the probability that the random variable X assumes a value less than or equal to a given x. This is calculated from the probability density function, as follows: Probability and Statistics(3/35) Concept
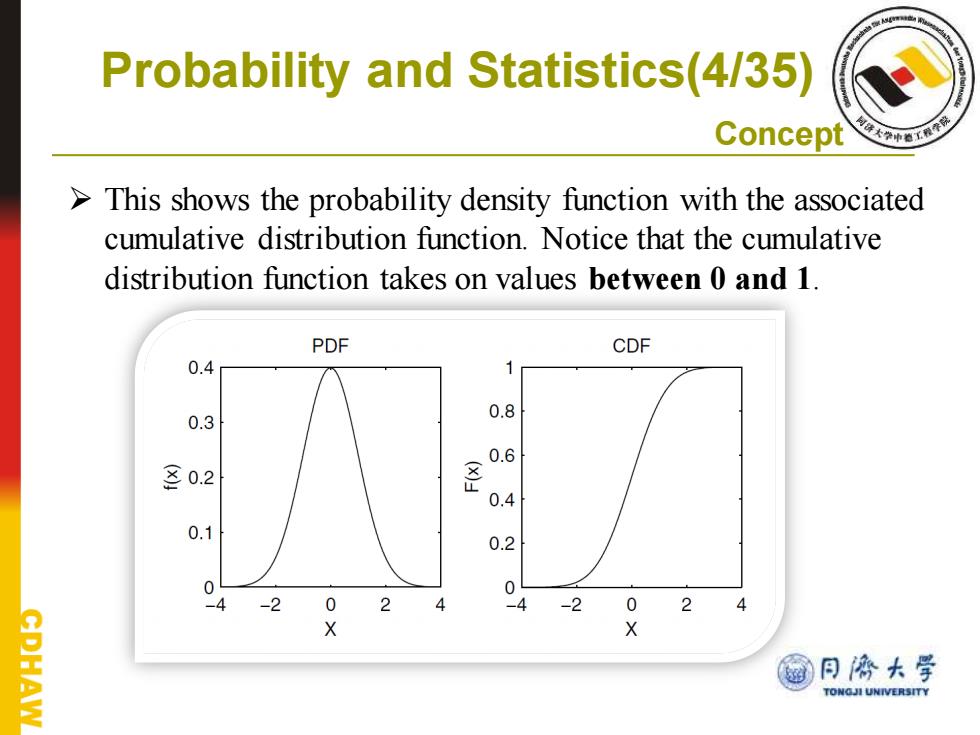
Probability and Statistics(4/35) Concept This shows the probability density function with the associated cumulative distribution function.Notice that the cumulative distribution function takes on values between 0 and 1. PDF CDF 0.4 0.3 0.8 0.6 80.2 0.4 0.1 0.2 0 0 -2 0 4 0 2 CDHAW @月停大学 TONGJI UNIVERSITY
➢ This shows the probability density function with the associated cumulative distribution function. Notice that the cumulative distribution function takes on values between 0 and 1. Probability and Statistics(4/35) Concept
Probability and Statistics(5/35) Concept The mean or expected value of a random variable is defined using the probability density (mass)function.It provides a measure of central tendency of the distribution. u=EX]=∫xfx)dx We see from the definition that the expected value is a sum of all possible values of the random variable where each one is weighted by the probability that x will take on that value. 日濟大学 AW TONGJI UNIVERSITY
➢ The mean or expected value of a random variable is defined using the probability density (mass) function. It provides a measure of central tendency of the distribution. We see from the definition that the expected value is a sum of all possible values of the random variable where each one is weighted by the probability that X will take on that value. Probability and Statistics(5/35) Concept