Plotting (6/43) example x =linspace(0,10,11); Plot of y =x2 -10.'x+15 y=x2-10.*x+15; y(x) plot(x,y); title('Plot of y x.2-10.*x+15); xlabel('x') ylabel('y') legend('y(x)'); text(5,-10,y(x)=0'); grid on; CPHAW @月协大学 TONGJI UNIVERSITY
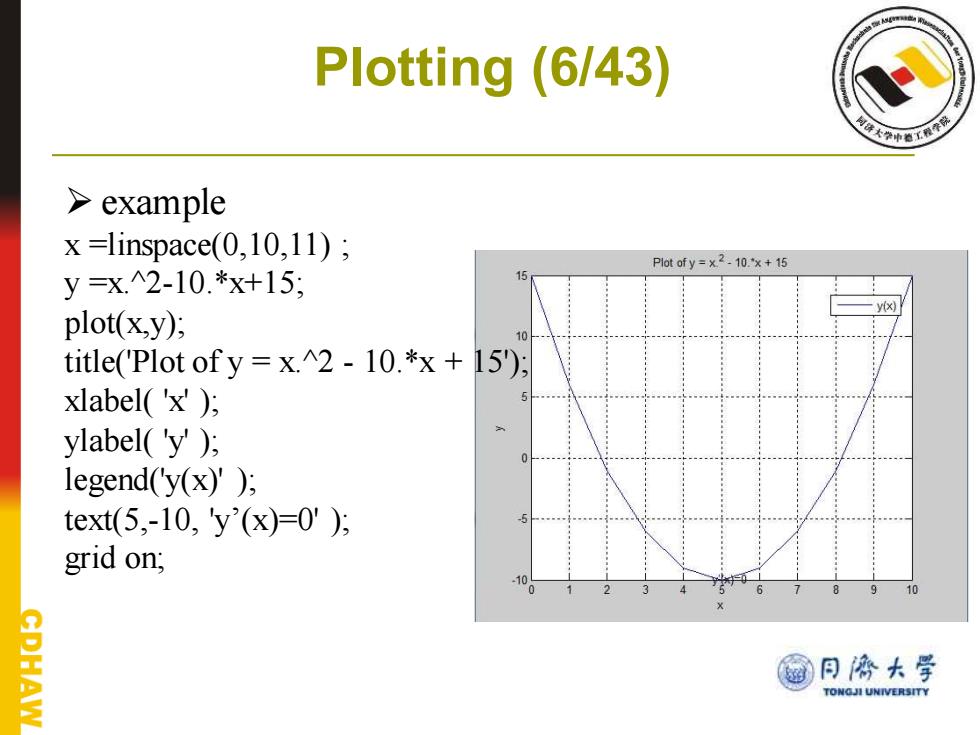
Plotting (6/43) ➢ example x =linspace(0,10,11) ; y =x.^2-10.*x+15; plot(x,y); title('Plot of y = x.^2 - 10.*x + 15'); xlabel( 'x' ); ylabel( 'y' ); legend('y(x)' ); text(5,-10, 'y’(x)=0' ); grid on;
Plotting (7/43) x=linspace(0,4*pi); sin(x)for [0,4 y=sin(x); plot(x,y); 0.6 0.4 title('sin(x)for [0,4 pi]'); 02 xlabel('x') ylabel('y') 0.6 grid on; 0.8 axis([04*pi-11])月 0 12 @日济大学 AW TONGJI UNIVERSITY
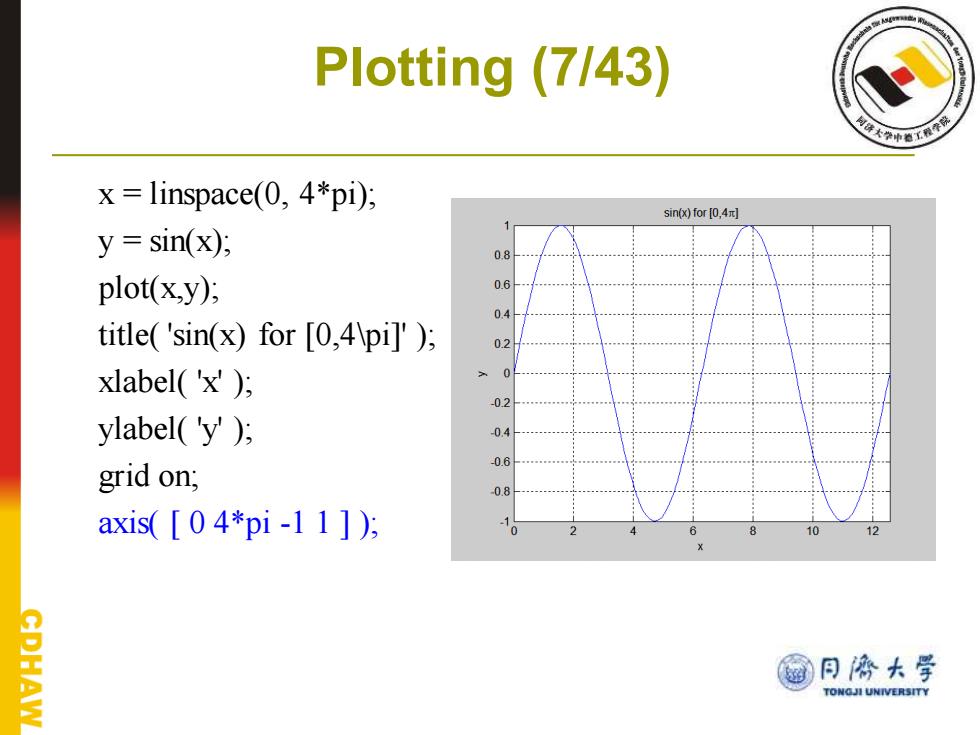
Plotting (7/43) x = linspace(0, 4*pi); y = sin(x); plot(x,y); title( 'sin(x) for [0,4\pi]' ); xlabel( 'x' ); ylabel( 'y' ); grid on; axis( [ 0 4*pi -1 1 ] );
Plotting (8/43) axis Control axis scaling and appearance axis[(XMIN XMAX YMIN YMAX)]sets scaling for the x-and y-axes on the current plot. axis equal sets the axis increments to be equal on both axes. axis auto returns the axis scaling to its default. axis off turns off all axis labeling,tick marks and background. axis on turns axis labeling,tick marks and background back on @月诱大学 TONGJI UNIVERSITY
Plotting (8/43) ➢ axis Control axis scaling and appearance. ✓ axis[(XMIN XMAX YMIN YMAX)] sets scaling for the x- and y-axes on the current plot. ✓ axis equal sets the axis increments to be equal on both axes. ✓ axis auto returns the axis scaling to its default. ✓ axis off turns off all axis labeling, tick marks and background. ✓ axis on turns axis labeling, tick marks and background back on
Plotting (9/43) a形 >Multiple Graphs x=0:pi/100:2*pi, y1=sin(2*x); y2=2*cos(2*x); plot(x.y1,x,y2); or x=0:pi/100:2*pi; y1=sin(2*x); y2=2*c0s(2*x); plot(x,y1); PHAW hold on @日济大学 plot(x.y2); TONGJI UNIVERSITY
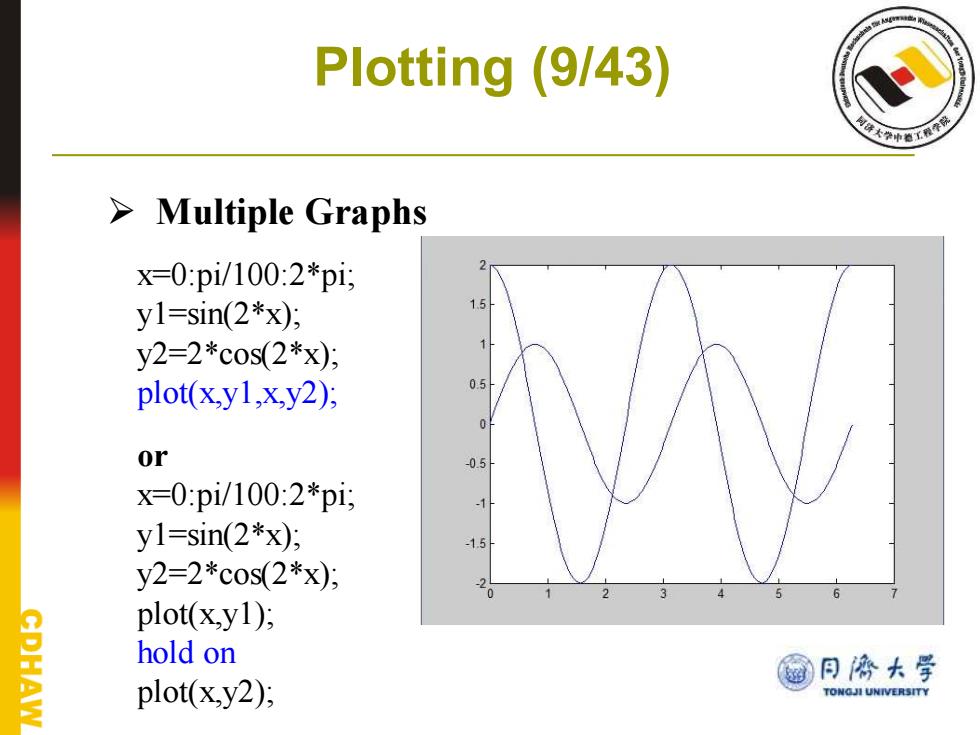
Plotting (9/43) ➢ Multiple Graphs x=0:pi/100:2*pi; y1=sin(2*x); y2=2*cos(2*x); plot(x,y1,x,y2); or x=0:pi/100:2*pi; y1=sin(2*x); y2=2*cos(2*x); plot(x,y1); hold on plot(x,y2);
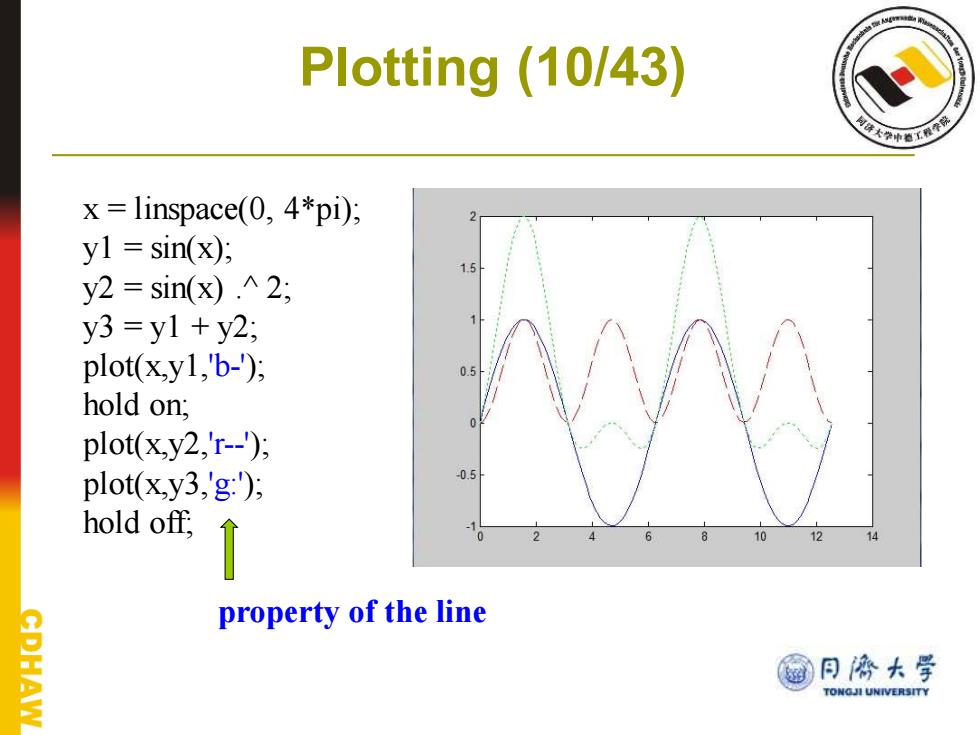
Plotting (10/43) x=linspace(0,4*pi); yl sin(x); y2=sin(x).^2; y3=y1+y2; plot(x,y1,'b-); hold on; plot(x.y2,'r--); plot(x,y3,'g:); hold off, ↑ 12 14 property of the line CDHAW @月协大学 TONGJI UNIVERSITY
Plotting (10/43) x = linspace(0, 4*pi); y1 = sin(x); y2 = sin(x) .^ 2; y3 = y1 + y2; plot(x,y1,'b-'); hold on; plot(x,y2,'r--'); plot(x,y3,'g:'); hold off; property of the line