
How Markets Process Information:News Releases and Volatility 1165 employment report was directly observed from the CBOT trading pit.Key figures appeared promptly at 8:30 and a paragraph of text was displayed on the screens within ten seconds or so.However,several traders said they don't normally watch the screen but simply react to the order flow.Also,the screens are not visible to all traders unless they turn their back on the trading pit.There appeared to be a flurry of phone orders within a few seconds of 8:30. Ⅱ.Volatility A.Intraday Volatility To examine intraday volatility,log returns,In(P/P-1),are calculated from prices on the nearby contract for each five-minute period over the trading day.Of course these "returns"measure price changes only.They are not returns in an investment sense since no money is actually invested up front.Standard deviations of these log returns calculated across all 775 trading days (November 7,1988 to November 29,1991)are shown in Figure 1.In this and other figures,the time on the horizontal axis indicates the end of the interval in eastern time,e.g.,8:35 for 8:30 to 8:35 returns.It is readily apparent that returns are much more variable over the 8:30 to 8:35 period than during any other five-minute period.In the T-bond market,the ratio of the 8:30 to 8:35 standard deviation to the next highest five-minute standard deviation is 2.4.In the Eurodollar and deutsche mark futures markets,this ratio is 2.6 and 1.9 respectively. Of particular interest is volatility at the open.Note that if one examines periods of fifteen minutes or longer for our futures contracts(e.g.,Harvey and Huang(1991,1992)or Ekman(1992)),prices appear to be more volatile at the open.However,prices over the first ten minutes,8:20 to 8:30,are not particularly volatile.It is between 8:30 and 8:35 that volatility is unusually high.Nine of our news releases occur at 8:30 including all three which several futures traders have told us are particularly important:the employ- ment report,the CPI,and the PPI.To determine if the intraday volatility patterns observed in Figure 1 are indeed due to these new releases,we divide the sample into those days with at least one of our nineteen new releases,457 days,and those with none,318 days.As shown in Figure 2,in the nonan- nouncement day set,the 8:30 to 8:35 spike disappears.5 4 The authors are grateful to Jerome Lacey and others at Prudential Securities for sharing their experiences on the market's reaction to these announcements and for arranging for one of the authors to visit the trading floor to observe the reaction to the May 8,1992 employment report. 5The days and times of the announcements were primarily determined from Business Week's "The Week Ahead"column.On the few occasions when an announcement was not reported in Business Week we use the government's "Schedule of Release Dates."Although the only major spike in Figure 1 is at 8:30,we include in our data set announcements at other times in order to determine if there is any impact on volatility at those times
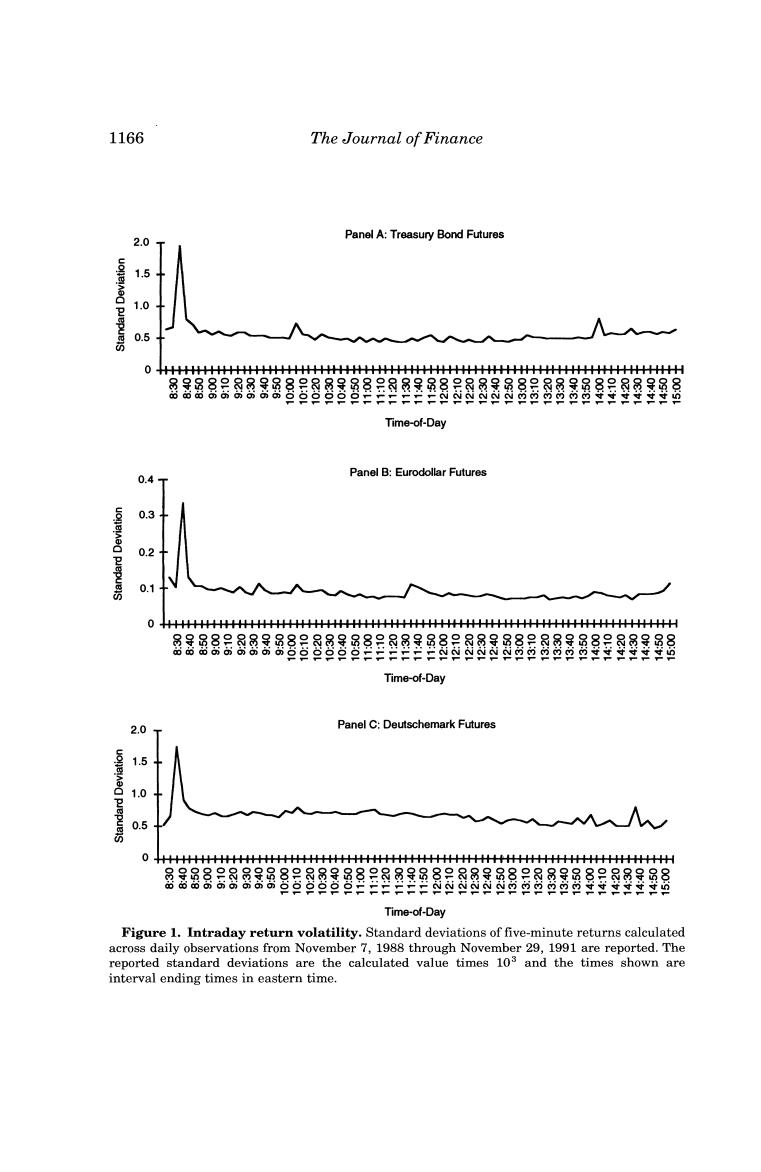
1166 The Journal of Finance Panel A:Treasury Bond Futures 2.0 15 1 0.5 0 ++++++++++++++++++++++++++H++++H+++++H 密8器g8经888888昌目的图程3的图器器器8器88群图强程昌 Time-of-Day Panel B:Eurodollar Futures 0.4 03 02 0.1 0H+H++H+++++++H+H+H+H+H Time-of-Day 2.0 Panel C:Deutschemark Futures 1.5 1.0 0.5 Time-of-Day Figure 1.Intraday return volatility.Standard deviations of five-minute returns calculated across daily observations from November 7,1988 through November 29,1991 are reported.The reported standard deviations are the calculated value times 103 and the times shown are interval ending times in eastern time
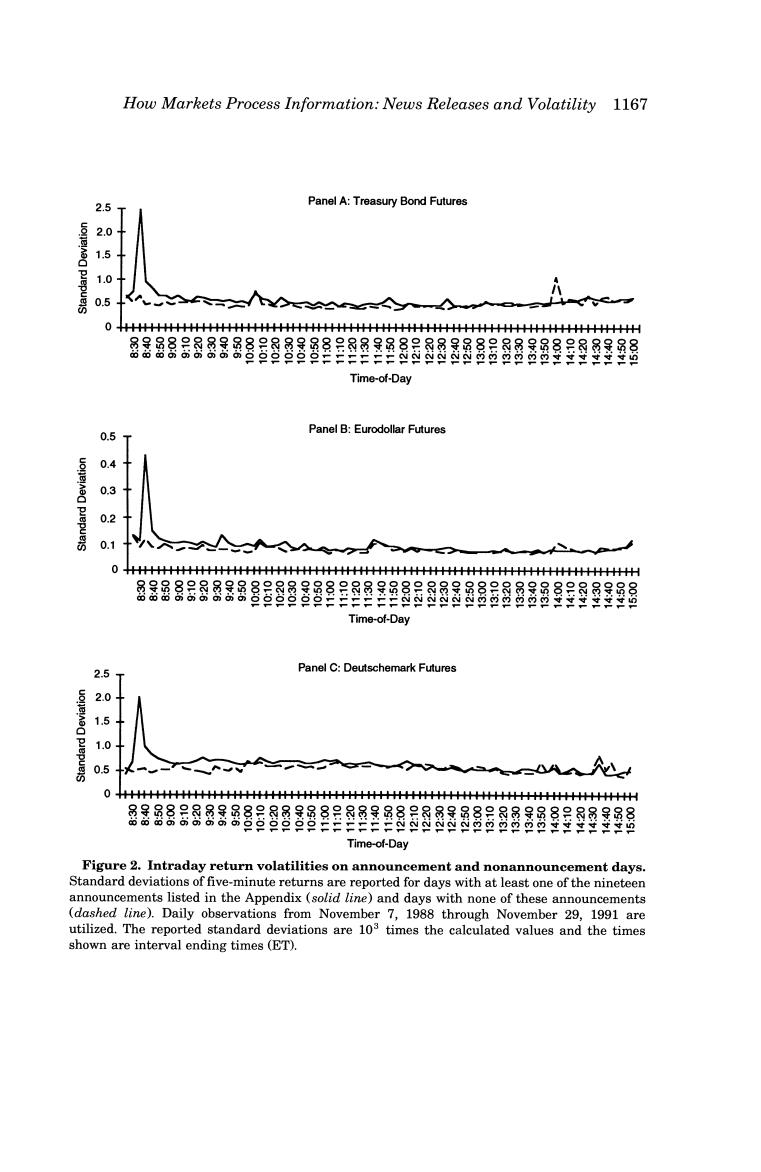
How Markets Process Information:News Releases and Volatility 1167 2.5 Panel A:Treasury Bond Futures 2 1.0 0 HHHHHHHHHHHHHHHHHHHHHHHHHHHHHHHHHHHHHHHHHHHHHHHHHHHHHHHHHHHHHHHHHHHHHHHHHHHHHH 居器88888昌8图器8程目图图强8弱图图是器8器8路品品程程强经经程 Time-of-Day Panel B:Eurodollar Futures 05 4 0.3 0.1 0 HHHHHHHHHHHHHHHHHHHHHHHHHHHHHHHHHHHHHHHHHHHHHHHHHHHHHHHHHHHHHHHHHHHHHHHHHHHH 居器器88888器8器8强目留甜图图器器品强屋器器星强经强强餐 Time-of-Day 2.5 Panel C:Deutschemark Futures 2.0 1. 0.5 +H+++H++++++H++H+++H+HH++H+++++H++HH 8器888品器器图8昌强图程8图备器品品器888品星程经强程 Time-of-Day Figure 2.Intraday return volatilities on announcement and nonannouncement days. Standard deviations of five-minute returns are reported for days with at least one of the nineteen announcements listed in the Appendix(solid line)and days with none of these announcements (dashed line).Daily observations from November 7,1988 through November 29,1991 are utilized.The reported standard deviations are 103 times the calculated values and the times shown are interval ending times(ET)
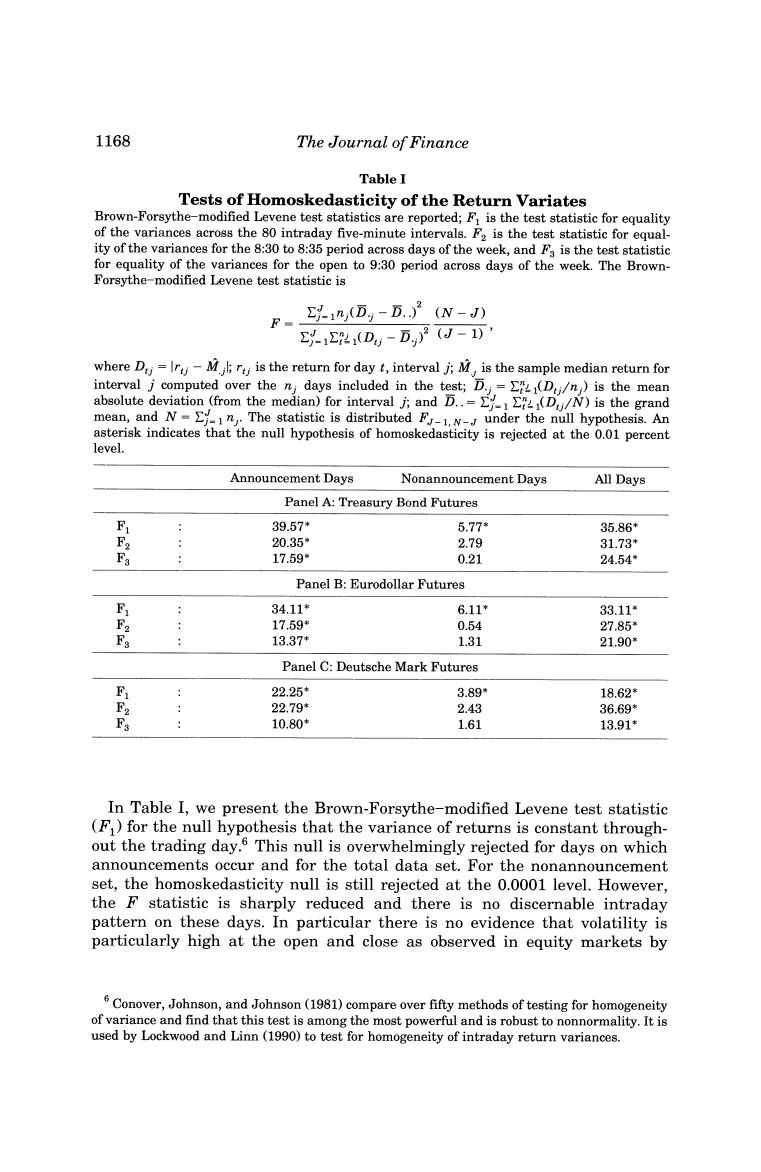
1168 The Journal of Finance Table I Tests of Homoskedasticity of the Return Variates Brown-Forsythe-modified Levene test statistics are reported;F is the test statistic for equality of the variances across the 80 intraday five-minute intervals.F2 is the test statistic for equal- ity of the variances for the 8:30 to 8:35 period across days of the week,and Fa is the test statistic for equality of the variances for the open to 9:30 period across days of the week.The Brown- Forsythe-modified Levene test statistic is F.(D,-D.2(w-) y4(Dw-D)2(J-1)’ where D=Iry-Ml;rt;is the return for day t,interval j;M,is the sample median return for interval j computed over the n;days included in the test;D.;=EL(Di/n,)is the mean absolute deviation (from the median)for interval j;and D..DN)is the grand mean,and N-E-1n,.The statistic is distributed F-1 w-,under the null hypothesis.An asterisk indicates that the null hypothesis of homoskedasticity is rejected at the 0.01 percent level. Announcement Days Nonannouncement Days All Days Panel A:Treasury Bond Futures F 39.57+ 5.77* 35.86* 20.35* 2.79 31.73* 17.59 0.21 24.54 Panel B:Eurodollar Futures 34.11* 6.11* 33.11* F2 17.59* 0.54 27.85* 13.37* 1.31 21.90* Panel C:Deutsche Mark Futures F 22.25* 3.89 18.62 F2 22.79* 2.43 36.69* 10.80* 1.61 13.91* In Table I,we present the Brown-Forsythe-modified Levene test statistic (F)for the null hypothesis that the variance of returns is constant through- out the trading day.This null is overwhelmingly rejected for days on which announcements occur and for the total data set.For the nonannouncement set,the homoskedasticity null is still rejected at the 0.0001 level.However, the F statistic is sharply reduced and there is no discernable intraday pattern on these days.In particular there is no evidence that volatility is particularly high at the open and close as observed in equity markets by 6 Conover,Johnson,and Johnson(1981)compare over fifty methods of testing for homogeneity of variance and find that this test is among the most powerful and is robust to nonnormality.It is used by Lockwood and Linn(1990)to test for homogeneity of intraday return variances
How Markets Process Information:News Releases and Volatility 1169 Wood,McInish,and Ord (1985),Lockwood and Linn (1990),and others. Indeed,one wonders if the high variance observed at the open in equity markets is partly due to the 8:30 news releases which occur shortly before the stock market opens.In the nonannouncement set,the highest variance in the T-bond market occurs at 1:55 to 2:00(10:00 to 10:05 if a single outlier is removed).?For Eurodollars and deutsche marks,the high points are at 8:20 to 8:25 (the open)and 2:30 to 2:35,respectively.Harvey and Huang (1992) hypothesize and present evidence that interest rate volatility tends to be high between 11:35 and 12:15 (ET)when a uniquely informed trader,the Federal Reserve,is actively trading.While we do not explicitly test their hypothesis, no such increase in volatility is apparent in Figures 1 and 2.In summary, although the null of homoskedasticity is rejected for nonannouncement days, there is no clear pattern,i.e.,volatility is basically flat across the trading day. B.Day-of-the-Week Effects Harvey and Huang(1991)observe that in the interest rate and foreign exchange futures markets,returns over the first sixty to seventy minutes of trading on Thursdays and Fridays are more volatile than during any other one-hour period during the week.8 They hypothesize that this is due to the fact that many news releases take place during this time on these days and present evidence in a later paper (1992)that this is the case.Our results further support their hypothesis.The distribution of our announcements by day of the week is reported in the Appendix.Among our 8:30 announcements, the employment report is always released on Friday and the PPI is usually released on Thursday or Friday.In Figures 3 and 4 we show 8:30 to 8:35 and 8:20 to 9:30 standard deviations for each day of the week for announcement days,nonannouncement days,and our complete sample.Volatility is particu- larly high on Fridays on which announcements occur.On nonannouncement Fridays,there is no such pattern.In Table I,we present Brown-Forsythe- modified Levene tests of the null that the variance is the same for all days of the week.F2 is the test statistic for the null that the 8:30 to 8:35 variance is the same on all five days and Fa is the equivalent test statistic for the 8:20 to 9:30 variance.Both are clearly rejected for the announcement and total samples but cannot be rejected for the nonannouncement sample.In sum- mary,intraday and interday volatility patterns in these markets appear to be due primarily to the timing of macroeconomic news releases. 7As shown in Figure 2,there is a"mini-spike"at 1:55 to 2:00 in the nonannouncement data set.This is due to a single outlier on January 9,1991 when Secretary of State Baker emerged from a meeting with Iraqi Foreign Minister Aziz and reported there was no indication Iraq would leave Kuwait peacefully.To avoid distortion,this outlier is eliminated in our subsequent analysis. 8 In a recent paper,Harvey and Huang(1992)calculate the variances of returns over the period from the open to 8:45 A.M.(ET)for days when at least one of six macroeconomic announcements occur and separately for days without any of the six.They observe a much higher variance on announcement days