
Efficiency witb Costly Information Table 2 a for alternative indexes With S&P indexes With combined indexes' Index 1945-1964 1965-1984 1945-1964 1965-1984 CRSP value-weighted -0.26 0.57 -0.71 2.21 CRSP equal-weighted -3.13 6.25 -3.91 8.41 CRSP small stock index -4.04 10.06 -5.07 12.38 All returns are in annual excess return form. Second index used by Ippolito (1989).It is constructed by equally weighting the s&P index and the Ibbotson-Singuefeld long-term bond index. should be good proxies for non-S&P stocks.We examine the impact of small stocks on a in two ways.The first uses the return indexes on deciles formed by market size constructed by the Center for Research in Security Prices (CRSP)at the University of Chicago.The CRSP return indexes are constructed by ranking all stocks listed on the NYSE by market capitalization,dividing the stocks into 10 equal-sized groups,and then value-weighting the return on individual stocks within each group.Table 1 shows the a for each of the 10 deciles in the Jensen period and in the Ippolito period.A manager who had no selection ability and selected part of the portfolio from non-S&P stocks would have shown a negative a in the Jensen period and a strong positive a in the Ippolito period.The average a of the smallest five deciles in the Jensen period is-4.17 percent,while in the Ippoli- to period it is +9.61 percent.Similar results are obtained when the analysis is repeated employing Ippolito's combined bond stock index as the independent variable defining a's.Negative a's for the small stock index in the Jensen period do not imply that the returns on the small stock index are less than returns on the S&P index.In fact,in the Jensen period they were higher.In Table 2,we present another illustration of the same phenomenon.The small stock index is a value- weighted index of the lowest quintile of the stocks listed on the NYSE.It is the standard small stock index used in many academic studies.In the Jensen period,the small stock index exhibited a neg- ative a of-4.04 percent,while in the Ippolito period the a is +10.06 percent. In Table 2,we also present the a's for market-weighted and equally weighted averages of all stocks on the NYSE.These a's reinforce the effects shown by examining deciles.Examination of the a's on the market-weighted CRSP index of all NYSE stocks shows that extending holdings beyond stocks in the S&P index,even when maintaining If security a's are a function of size as in Table 1,the CRSP weighting procedure understates the a compared to equal weighting when a's increase with decreasing size and overstates the a when a decreases with increasing size. 5
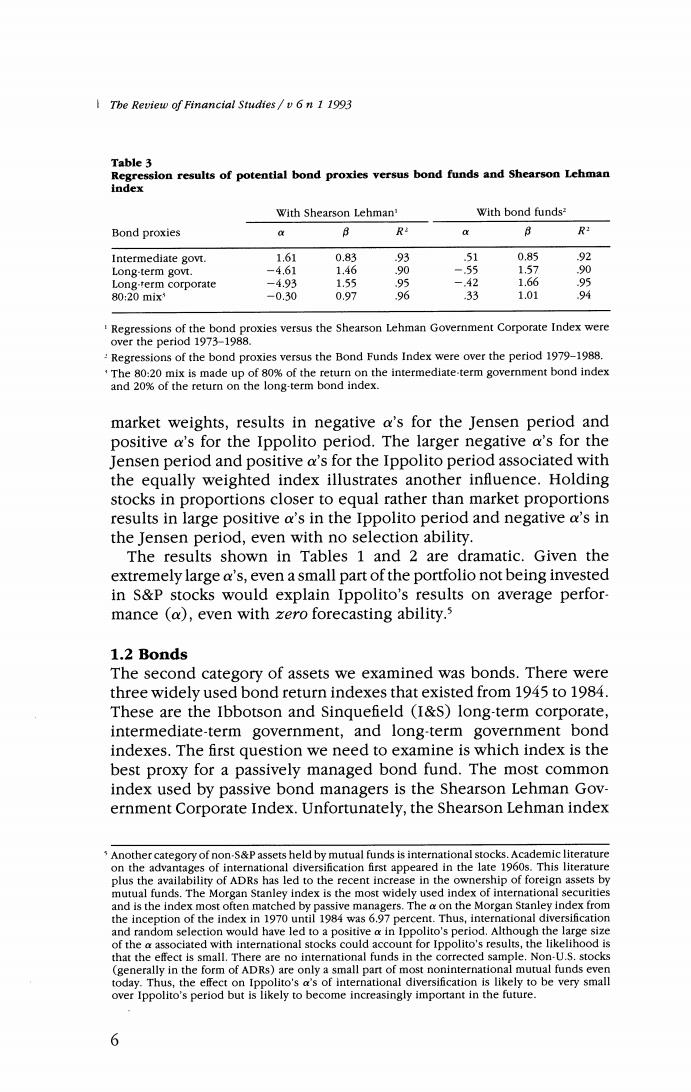
The Review of Financial Studies/v 6n 1 1993 Table 3 Regression results of potential bond proxies versus bond funds and Shearson Lehman index With Shearson Lehman' With bond funds? Bond proxies 心 R 8 R Intermediate govt. 1.61 0.83 93 51 0.85 92 Long-term govt. -4.61 1.46 90 -.55 1.57 0 Long-term corporate -4.93 1.55 -.42 1.66 95 80:20mix -0.30 0.97 % 33 1.01 Regressions of the bond proxies versus the Shearson Lehman Government Corporate Index were over the period 1973-1988. Regressions of the bond proxies versus the Bond Funds Index were over the period 1979-1988. The 80:20 mix is made up of 80%of the return on the intermediate.term government bond index and 20%of the return on the long-term bond index. market weights,results in negative a's for the Jensen period and positive a's for the Ippolito period.The larger negative a's for the Jensen period and positive a's for the Ippolito period associated with the equally weighted index illustrates another influence.Holding stocks in proportions closer to equal rather than market proportions results in large positive a's in the Ippolito period and negative a's in the Jensen period,even with no selection ability. The results shown in Tables 1 and 2 are dramatic.Given the extremely large a's,even a small part of the portfolio not being invested in S&P stocks would explain Ippolito's results on average perfor- mance (a),even with zero forecasting ability.s 1.2 Bonds The second category of assets we examined was bonds.There were three widely used bond return indexes that existed from 1945 to 1984. These are the Ibbotson and Sinquefield (I&S)long-term corporate, intermediate-term government,and long-term government bond indexes.The first question we need to examine is which index is the best proxy for a passively managed bond fund.The most common index used by passive bond managers is the Shearson Lehman Gov- ernment Corporate Index.Unfortunately,the Shearson Lehman index Another category of non-S&P assets held by mutual funds is international stocks.Academic literature on the advantages of international diversification first appeared in the late 1960s.This literature plus the availability of ADRs has led to the recent increase in the ownership of foreign assets by mutual funds.The Morgan Stanley index is the most widely used index of international securities and is the index most often matched by passive managers.The a on the Morgan Stanley index from the inception of the index in 1970 until 1984 was 6.97 percent.Thus,international diversification and random selection would have led to a positive a in Ippolito's period.Although the large size of the a associated with international stocks could account for Ippolito's results,the likelihood is that the effect is small.There are no international funds in the corrected sample.Non-U.S.stocks (generally in the form of ADRs)are only a small part of most noninternational mutual funds even today.Thus,the effect on Ippolito's a's of international diversification is likely to be very small over Ippolito's period but is likely to become increasingly important in the future. 6
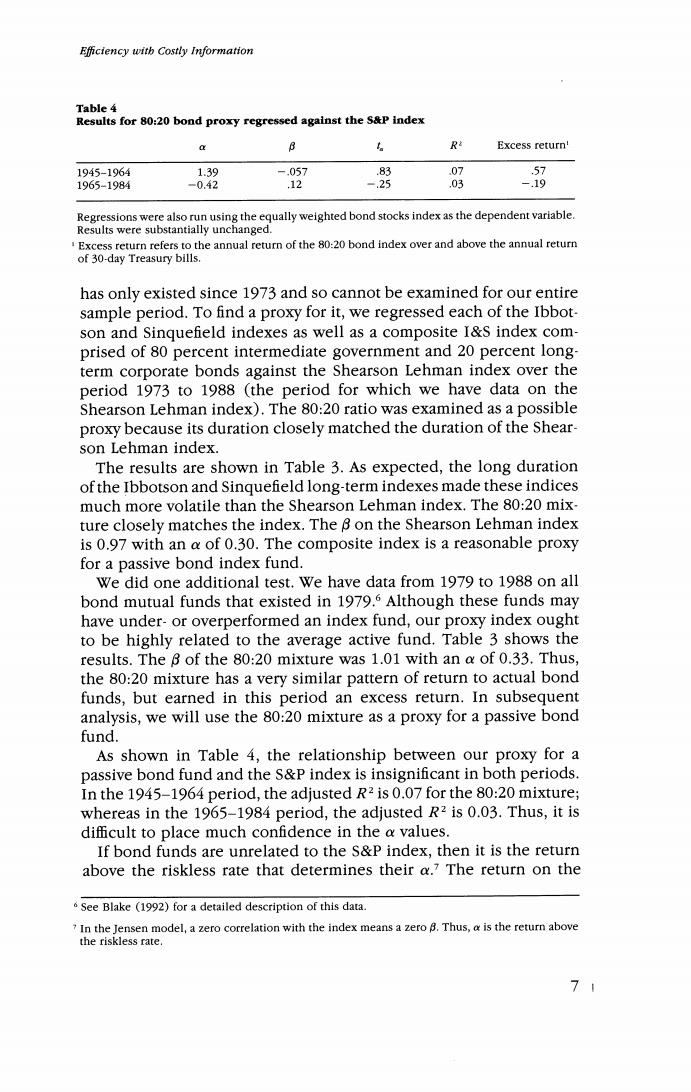
Efficiency witb Costly Information Table 4 Results for 80:20 bond proxy regressed against the S&P index a B R Excess return' 1945-1964 1.39 -.057 83 .07 57 1965-1984 -0.42 .12 -.25 .03 -.19 Regressions were also run using the equally weighted bond stocks index as the dependent variable. Results were substantially unchanged. Excess return refers to the annual return of the 80:20 bond index over and above the annual return of 30-day Treasury bills. has only existed since 1973 and so cannot be examined for our entire sample period.To find a proxy for it,we regressed each of the Ibbot- son and Sinquefield indexes as well as a composite I&S index com- prised of 80 percent intermediate government and 20 percent long- term corporate bonds against the Shearson Lehman index over the period 1973 to 1988 (the period for which we have data on the Shearson Lehman index).The 80:20 ratio was examined as a possible proxy because its duration closely matched the duration of the Shear- son Lehman index. The results are shown in Table 3.As expected,the long duration of the Ibbotson and Sinquefield long-term indexes made these indices much more volatile than the Shearson Lehman index.The 80:20 mix- ture closely matches the index.The 8 on the Shearson Lehman index is 0.97 with an a of 0.30.The composite index is a reasonable proxy for a passive bond index fund. We did one additional test.We have data from 1979 to 1988 on all bond mutual funds that existed in 1979.5 Although these funds may have under-or overperformed an index fund,our proxy index ought to be highly related to the average active fund.Table 3 shows the results.The B of the 80:20 mixture was 1.01 with an a of 0.33.Thus, the 80:20 mixture has a very similar pattern of return to actual bond funds,but earned in this period an excess return.In subsequent analysis,we will use the 80:20 mixture as a proxy for a passive bond fund. As shown in Table 4,the relationship between our proxy for a passive bond fund and the S&P index is insignificant in both periods. In the 1945-1964 period,the adjusted R2 is 0.07 for the 80:20 mixture; whereas in the 1965-1984 period,the adjusted R2 is 0.03.Thus,it is difficult to place much confidence in the a values. If bond funds are unrelated to the S&P index,then it is the return above the riskless rate that determines their a.7 The return on the See Blake (1992)for a detailed description of this data. 7 In the Jensen model,a zero correlation with the index means a zero B.Thus,a is the return above the riskless rate. 71