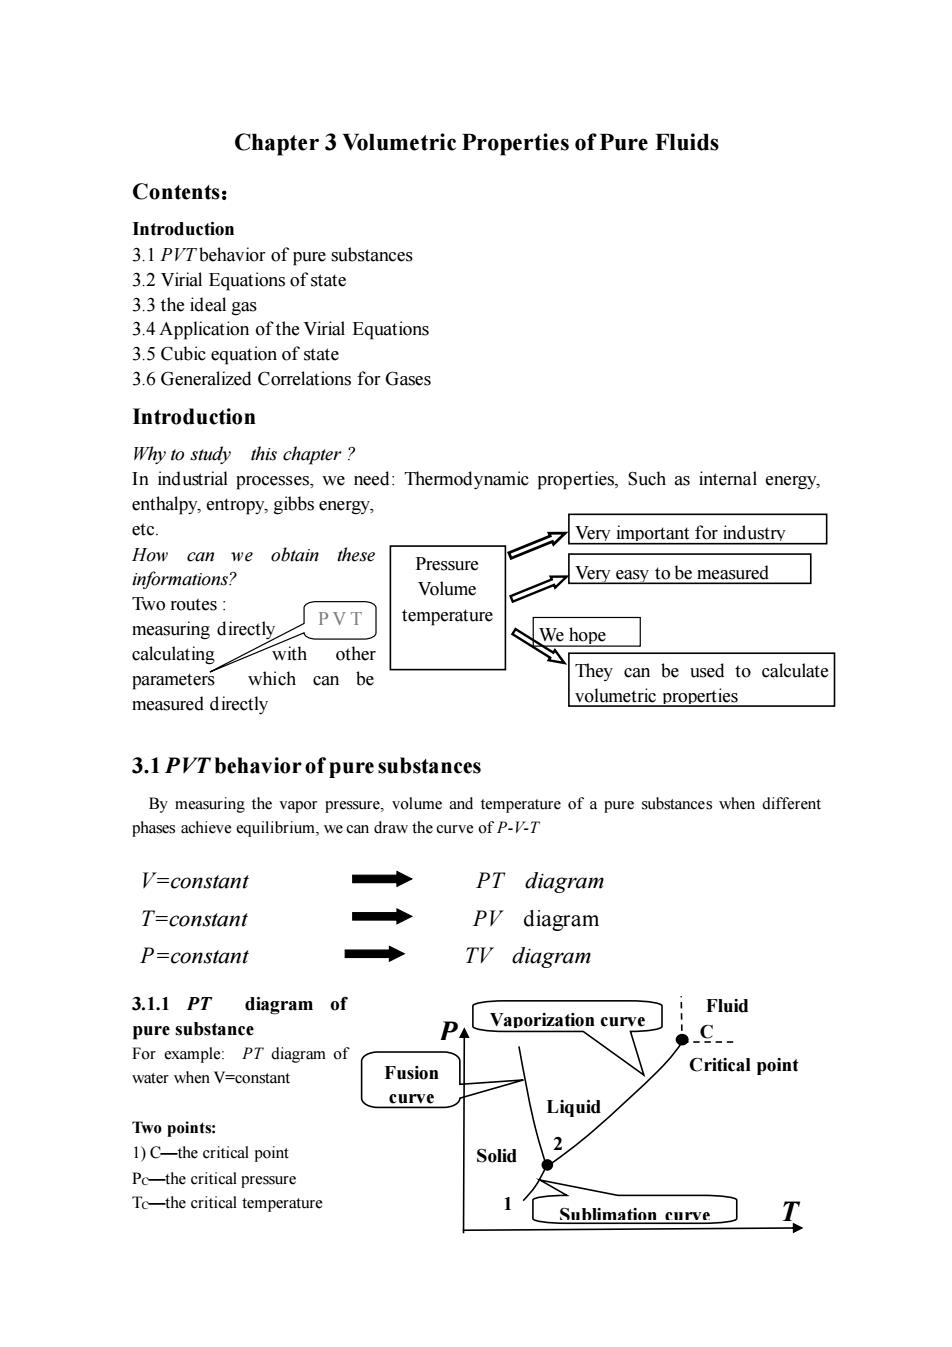
Chapter 3 Volumetric Properties of Pure Fluids Contents: Introduction 3.1 PVTbehavior of pure substances 3 2 Virial Fquations of state 3.3 the ideal gas 3.4 Application of the Virial Equations 3.5 Cubic equation of state 3.6 Generalized Correlations for Gases Introduction Why to study this chapter? In industrial processes,we need:Thermodynamic properties,Such as intemal energy, enthalpy.entropy.gibbs energy. etc Very important for industrv How can we obtain these Pressure Very easy to be measured Two routes: PVT temperature measuring directly We hope calculating with other which can be They can be used to calculate measured directly volumetric properties 3.1 PIT behavior of pure substances By measuring the vapor pressure,volume and temperature of a pure substances when different phases ,we can d raw the curve of p. V=constant ◆ PT diagram T=constant ◆ Py diagram P=constant Ty diagram 3.1.1PT diagram of Fluid pure substance P Vaporization curve C. For example:PT diagram of water when V=constant Fusion Critical point curve Liquid Two points: 1)C-the critical point Solid 2 Pc-the critical pressure To-the critical temperature Sublimation curve
Chapter 3 Volumetric Properties of Pure Fluids Contents: Introduction 3.1 PVT behavior of pure substances 3.2 Virial Equations of state 3.3 the ideal gas 3.4 Application of the Virial Equations 3.5 Cubic equation of state 3.6 Generalized Correlations for Gases Introduction Why to study this chapter ? In industrial processes, we need: Thermodynamic properties, Such as internal energy, enthalpy, entropy, gibbs energy, etc. How can we obtain these informations? Two routes : measuring directly calculating with other parameters which can be measured directly 3.1 PVT behavior of pure substances By measuring the vapor pressure, volume and temperature of a pure substances when different phases achieve equilibrium, we can draw the curve of P-V-T 3.1.1 PT diagram of pure substance For example: PT diagram of water when V=constant Two points: 1) C—the critical point PC—the critical pressure TC—the critical temperature V=constant PT diagram T=constant PV diagram P=constant TV diagram P V T Very important for industry Pressure Volume temperature They can be used to calculate volumetric properties Very easy to be measured We hope P T Liquid Solid Critical point Sublimation curve Fusion curve Vaporization curve Fluid C 1 2
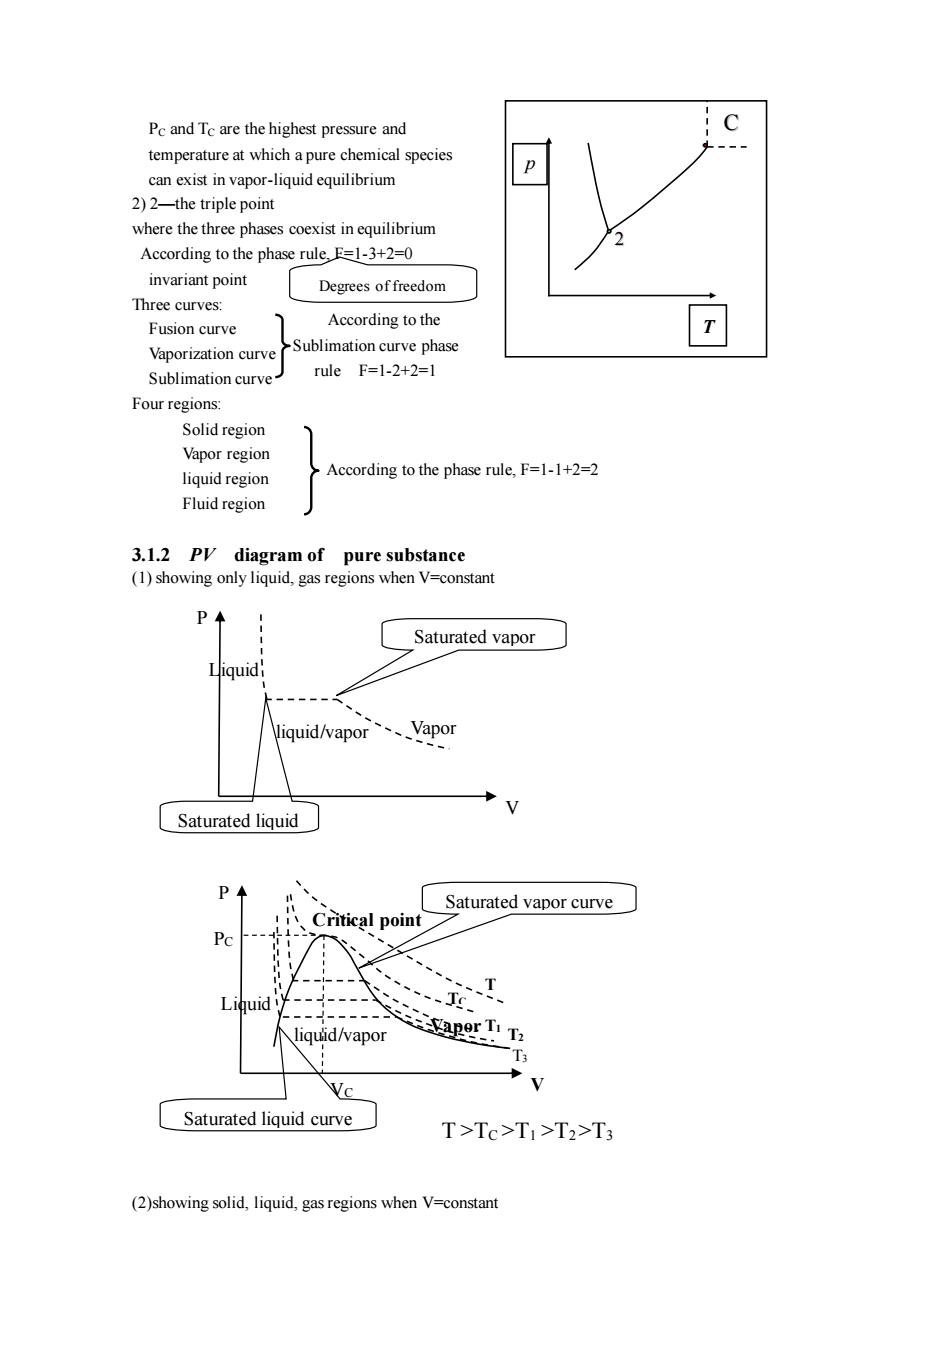
Pc and Tc are the highest pressure and temperature at which apure chemical species can exist in vapor-liquid equilibrium 2)2-the triple point where the three phases coexist in equilibrium According to the phase rule.E=1-3+2=0 invariant point Degrees of freedom Three curves: According to the Fusion curve Vaporization curve Sublimation curve phase Sublimation curve ruleF=1-2+2=l Four regions: Vapor region liquid region According to the phase rule,F=1-1+2=2 Fluid region 3.12P diagram of pure substance (1)showing only liquid,gas regions when V=constant Saturated vapor Niquid/vapor、Vapor Saturated liquid Saturated vapor curve al po vapo Saturated liquid curve T>Tc>TI>T2>T3 (2)showing solid,liquid,gas regions when V-constant
PC and TC are the highest pressure and temperature at which a pure chemical species can exist in vapor-liquid equilibrium 2) 2—the triple point where the three phases coexist in equilibrium According to the phase rule, F=1-3+2=0 invariant point Three curves: Fusion curve Vaporization curve Sublimation curve Four regions: Solid region Vapor region liquid region Fluid region 3.1.2 PV diagram of pure substance (1) showing only liquid, gas regions when V=constant (2)showing solid, liquid, gas regions when V=constant Degrees of freedom According to the phase rule, F=1-1+2=2 C p T 2 According to the Sublimation curve phase rule F=1-2+2=1 Vapor Liquid V P Saturated liquid liquid/vapor Saturated vapor Vapor T1 VC T TC PC liquid/vapor Liquid P Critical point Saturated vapor curve Saturated liquid curve V T >TC >T1 >T2 >T3 T2 T3
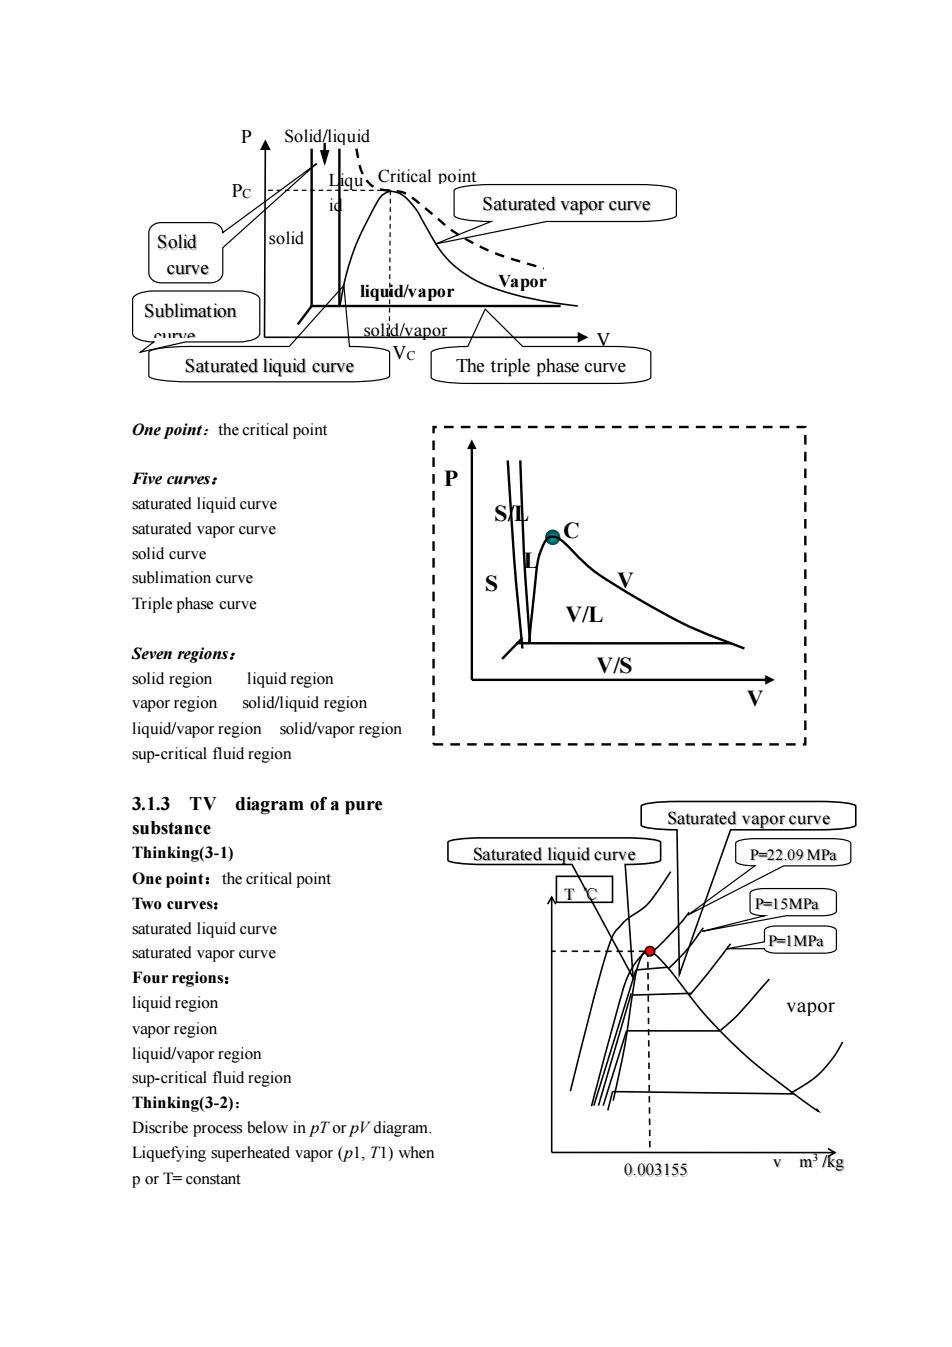
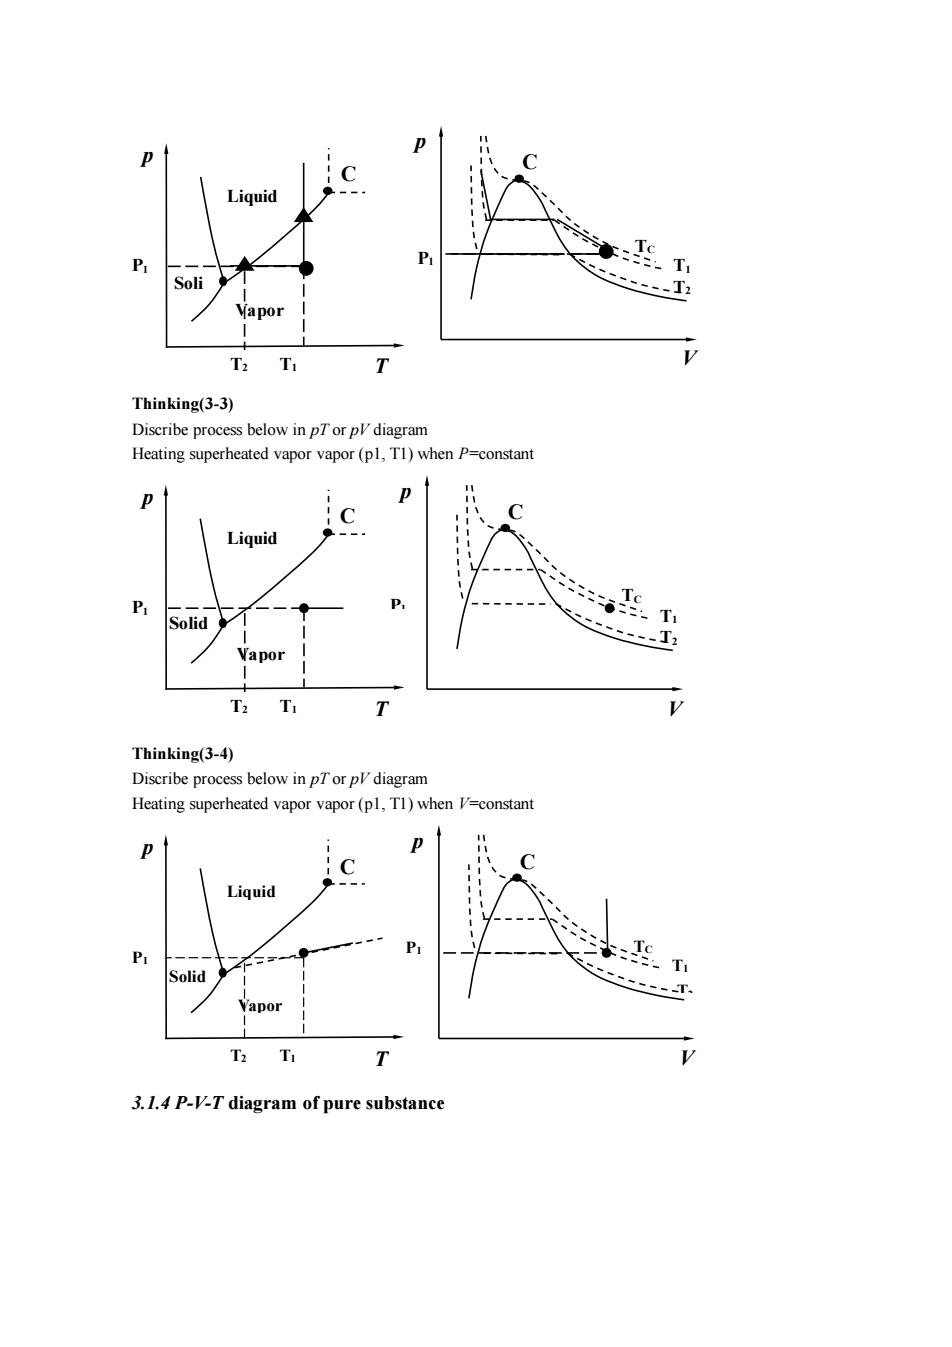
Solid/liquid gu、 Saturated vapor curve Solid solic curve liquid/apor Vapor Sublimation solid/vapor Saturated liquid curve The triple phase curve Five curves: saturated liquid curve saturated vapor curve solidcurve Triple phase curve V/L Seven regions: solid region liquid region VIS apor region solidniquidregiorn liquid/vapor region solid/vapor region sup-critical fluid region 3.1.3 TV diagram of a pure substance Saturated vapor curve Thinking(3-l) Saturated liquid curve P-22.09MP One point:the critical point Two curves: P-15MPa saturated liguid curve saturated vapor curve P-IMPa Four regions: liquid region vapo】 vapor region liquid/vapor region sup-critical fluid region Thinking(3-2): Diseribe process below diagram Liquefying superheated vapor(pl.T1)when porT=constant 0.003155
One point:the critical point Five curves: saturated liquid curve saturated vapor curve solid curve sublimation curve Triple phase curve Seven regions: solid region liquid region vapor region solid/liquid region liquid/vapor region solid/vapor region sup-critical fluid region 3.1.3 TV diagram of a pure substance Thinking(3-1) One point:the critical point Two curves: saturated liquid curve saturated vapor curve Four regions: liquid region vapor region liquid/vapor region sup-critical fluid region Thinking(3-2): Discribe process below in pT or pV diagram. Liquefying superheated vapor (p1, T1) when p or T= constant PC VC liquid/vapor Vapor Solid/liquid solid/vapor Saturated vapor curve P V Liqu id Critical point solid Saturated liquid curve Solid curve Sublimation curve The triple phase curve P V S S/L L C V V/S V/L vapor Saturated vapor curve Saturated liquid curve T ℃ 0.003155 v m 3 /kg P=22.09 MPa P=15MPa P=1MPa
:T T 、-T Thinking(3-3) Discribe process below in Heating superheated vapor vapor (pl,Tl)when P=constan Liquid T Vapor T2 T T Thinking(3-4) Discribe process below in pTor pl diagram Heating superheated vapor vapor (pl,T1)when V-constant Liquid T 3.1.4 P-V-T diagram of pure substance
Thinking(3-3) Discribe process below in pT or pV diagram Heating superheated vapor vapor (p1, T1) when P=constant Thinking(3-4) Discribe process below in pT or pV diagram Heating superheated vapor vapor (p1, T1) when V=constant 3.1.4 P-V-T diagram of pure substance T2 T1 P1 p T Liquid Vapor Soli d C P1 p V TC C T2 T1 T2 P1 p T Liquid Vapor Solid C T1 P1 p V TC C T2 T1 P1 T2 p T Liquid Vapor Solid C T1 P1 p V TC C T2 T1
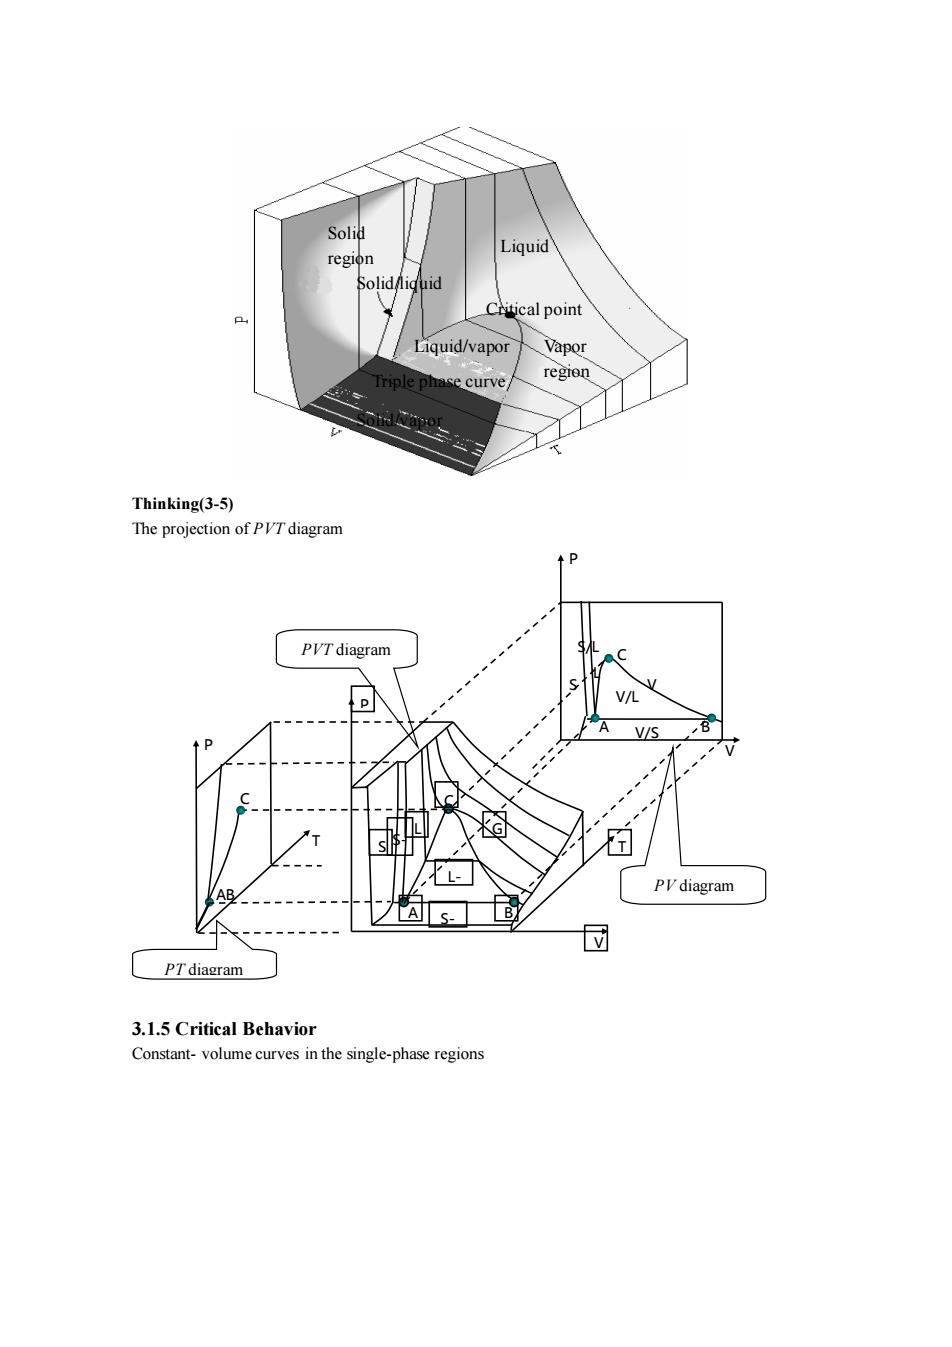
egion Ctitical point Liquid/vapor Vapo curve Thinking(3-5) The projection of PVTdiagram P V/S PV diagram A< 3.1.5 Critical Behavior Constant-volume curves in the single-phase regions
Thinking(3-5) The projection of PVT diagram 3.1.5 Critical Behavior Constant- volume curves in the single-phase regions P PV diagram PT diagram B C A L AB P T V C S V V L P T A B C S G L- G S- G S- L S/L V/L V/S PVT diagram Solid region Solid/liquid Liquid regi on Liquid/vapor Vapor region Critical point Triple phase curve Solid/vapor