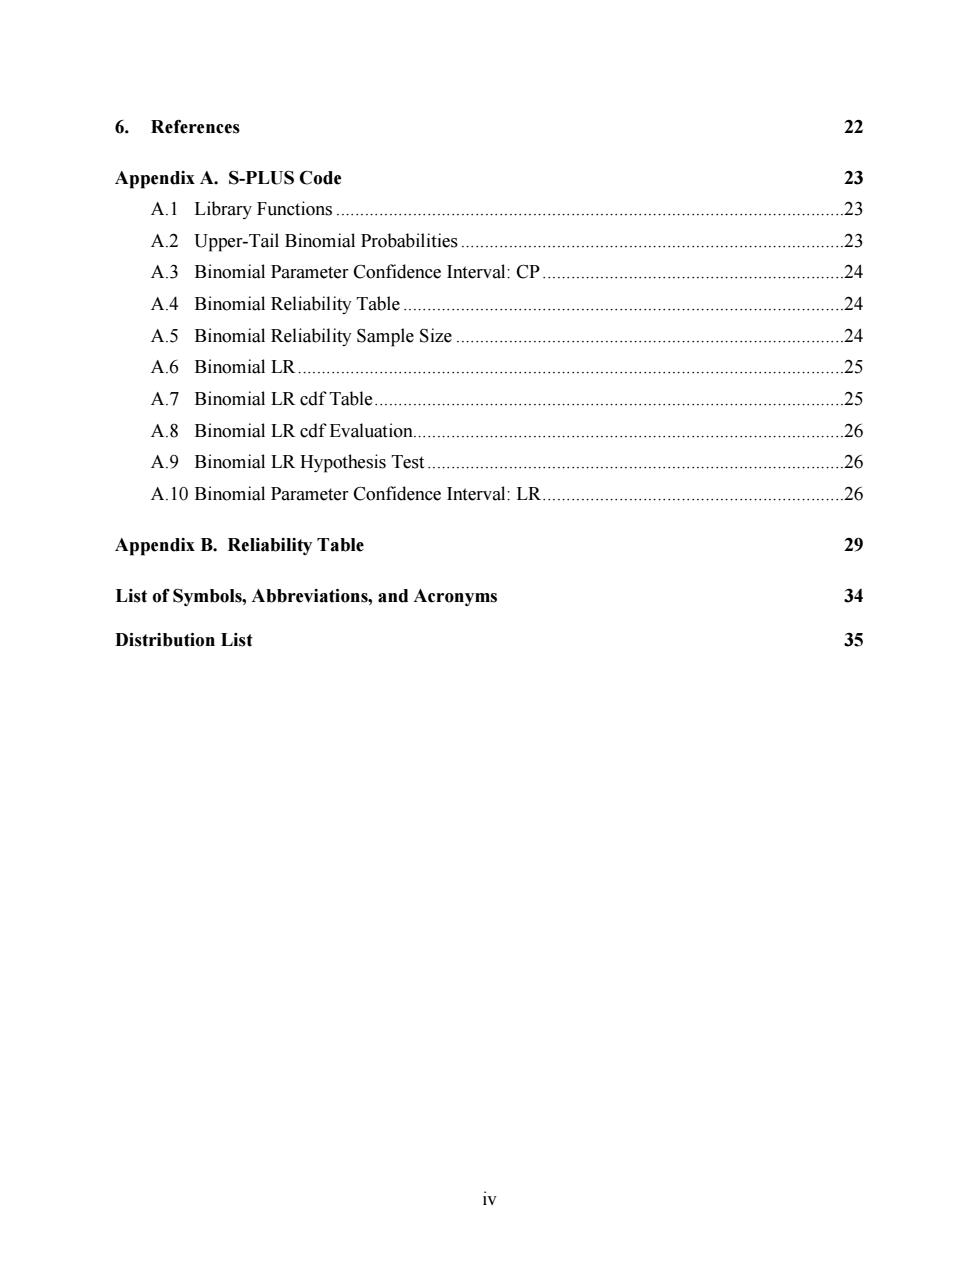
6.References 22 Appendix A.S-PLUS Code 23 A.1 Library Functions. 23 A.2 Upper-Tail Binomial Probabilities 23 A.3 Binomial Parameter Confidence Interval:CP 24 A.4 Binomial Reliability Table. 24 A.5 Binomial Reliability Sample Size 24 A.6 Binomial LR............ 25 A.7 Binomial LR cdf Table 25 A.8 Binomial LR cdf Evaluation....... 26 A.9 Binomial LR Hypothesis Test 26 A.10 Binomial Parameter Confidence Interval:LR 26 Appendix B.Reliability Table 29 List of Symbols,Abbreviations,and Acronyms 34 Distribution List 35 iv
iv 6. References 22 Appendix A. S-PLUS Code 23 A.1 Library Functions ..........................................................................................................23 A.2 Upper-Tail Binomial Probabilities ................................................................................23 A.3 Binomial Parameter Confidence Interval: CP ...............................................................24 A.4 Binomial Reliability Table ............................................................................................24 A.5 Binomial Reliability Sample Size .................................................................................24 A.6 Binomial LR ..................................................................................................................25 A.7 Binomial LR cdf Table ..................................................................................................25 A.8 Binomial LR cdf Evaluation..........................................................................................26 A.9 Binomial LR Hypothesis Test .......................................................................................26 A.10 Binomial Parameter Confidence Interval: LR ...............................................................26 Appendix B. Reliability Table 29 List of Symbols, Abbreviations, and Acronyms 34 Distribution List 35

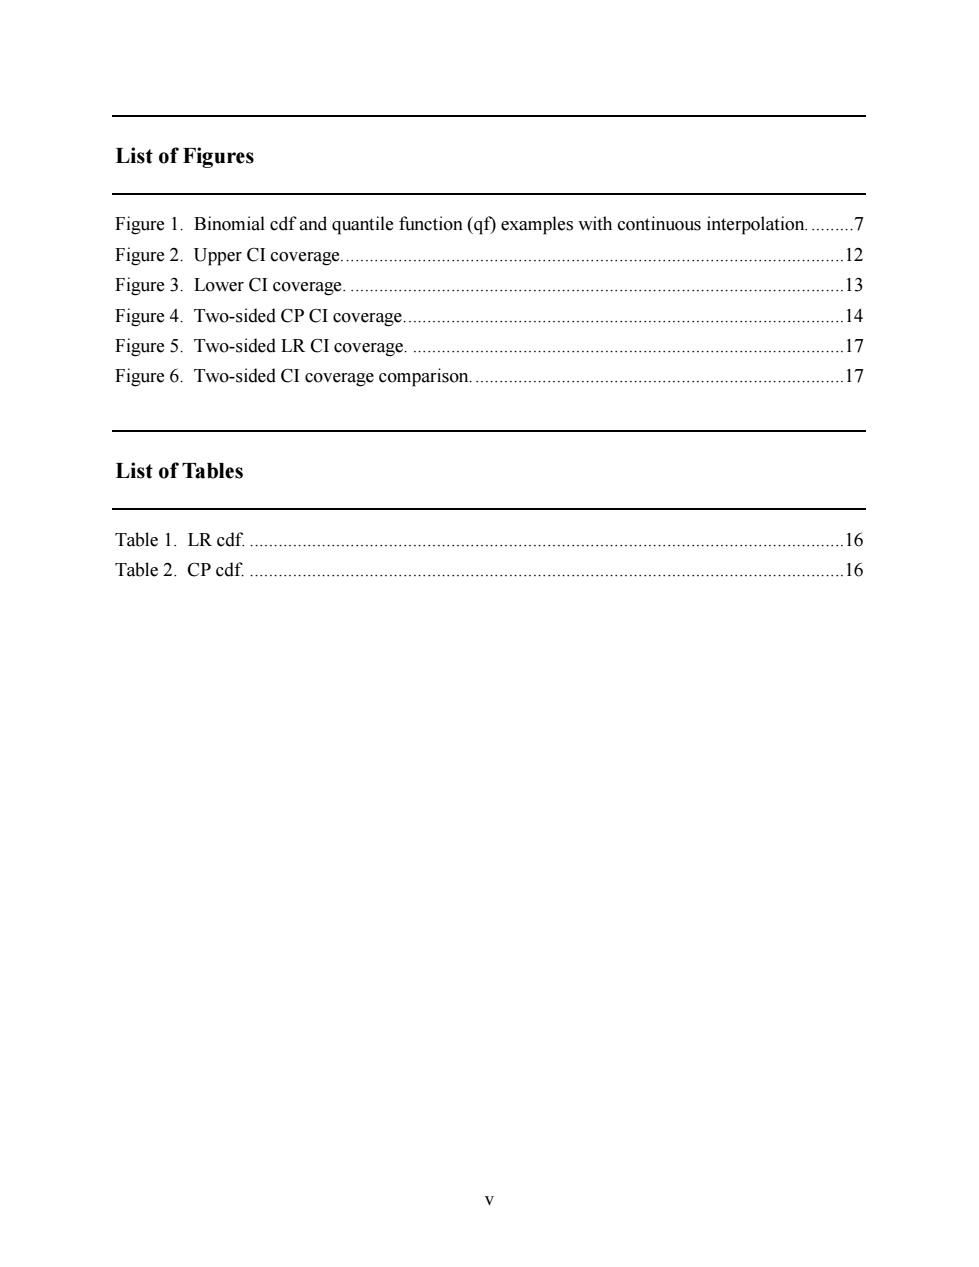
List of Figures Figure 1.Binomial cdf and quantile function(qf)examples with continuous interpolation.........7 Figure 2.Upper CI coverage.. 12 Figure 3.Lower CI coverage. .13 Figure 4.Two-sided cp CI coverage.. .14 Figure 5.Two-sided LR CI coverage. 17 Figure 6.Two-sided CI coverage comparison............... 17 List of Tables Table 1.LR cdf. 16 Table2.CP cdf.… …16
v List of Figures Figure 1. Binomial cdf and quantile function (qf) examples with continuous interpolation. .........7 Figure 2. Upper CI coverage. ........................................................................................................12 Figure 3. Lower CI coverage. .......................................................................................................13 Figure 4. Two-sided CP CI coverage. ...........................................................................................14 Figure 5. Two-sided LR CI coverage. ..........................................................................................17 Figure 6. Two-sided CI coverage comparison. .............................................................................17 List of Tables Table 1. LR cdf. ............................................................................................................................16 Table 2. CP cdf. ............................................................................................................................16

INTENTIONALLY LEFT BLANK. 与
vi INTENTIONALLY LEFT BLANK

Summary The purpose of this report is to provide statisticians with the tools to solve certain reliability problems that arise in consultations with clients. Statisticians often encounter clients seeking answers to questions such as,"I did an experiment 6 times with 3 successes and 3 failures,so the success rate is 50%,right?"A reasonable,useful, and informative response from the statistician would be,"yes,the estimate of success is 50%,but you can only state with 90%confidence that the true success rate lies between 15%and 85%.If you want to tighten that up,you need a larger sample."The client asks,"how large?"and the conversation proceeds from there. A client may pose a problem such as,"I need 90%confidence on 95%reliability.Can I do this with 10 runs?"The statistician can truthfully answer,no.You need 29 with no failures or 46 with 1 failure to assert 95%reliability with 90%confidence."The client may respond,"well, what can I get with I failure in 20?"and so the consultation continues. In fact,the solutions to both of these problems exploit properties of the binomial distribution. System requirements can be expressed in terms of an upper(lower)limit on the probability of failure(success).Statistical analysis of such binary (0/1,success/failure,go/no-go)data typically requires point and interval estimation and inference or hypothesis tests on the associated event probability.For identical independent trials,the proportion observed serves as an estimate of the event rate.Based on the method of Clopper-Pearson(CP)and the likelihood ratio(LR)technique properties of the binomial distribution are used to derive interval estimates, which are in turn used in inference.An application is the determination of sample size and maximum permissible number of failures(nf)required to establish a specific reliability (probability of success)with given probability(confidence). The statistician needs to address such issues and answer these questions in real time.This report provides the necessary technology expressed in the S-PLUS/S/R statistical computing environment language family,implementations of which are available as both commercial and free open-source software 1
1 Summary The purpose of this report is to provide statisticians with the tools to solve certain reliability problems that arise in consultations with clients. Statisticians often encounter clients seeking answers to questions such as, “I did an experiment 6 times with 3 successes and 3 failures, so the success rate is 50%, right?” A reasonable, useful, and informative response from the statistician would be, “yes, the estimate of success is 50%, but you can only state with 90% confidence that the true success rate lies between 15% and 85%. If you want to tighten that up, you need a larger sample.” The client asks, “how large?” and the conversation proceeds from there. A client may pose a problem such as, “I need 90% confidence on 95% reliability. Can I do this with 10 runs?” The statistician can truthfully answer, no. You need 29 with no failures or 46 with 1 failure to assert 95% reliability with 90% confidence." The client may respond, “well, what can I get with 1 failure in 20?” and so the consultation continues. In fact, the solutions to both of these problems exploit properties of the binomial distribution. System requirements can be expressed in terms of an upper (lower) limit on the probability of failure (success). Statistical analysis of such binary (0/1, success/failure, go/no-go) data typically requires point and interval estimation and inference or hypothesis tests on the associated event probability. For identical independent trials, the proportion observed serves as an estimate of the event rate. Based on the method of Clopper-Pearson (CP) and the likelihood ratio (LR) technique properties of the binomial distribution are used to derive interval estimates, which are in turn used in inference. An application is the determination of sample size and maximum permissible number of failures (nf) required to establish a specific reliability (probability of success) with given probability (confidence). The statistician needs to address such issues and answer these questions in real time. This report provides the necessary technology expressed in the S-PLUS / S / R statistical computing environment language family, implementations of which are available as both commercial and free open-source software

INTENTIONALLY LEFT BLANK. 2
2 INTENTIONALLY LEFT BLANK